About Our Great Lakes: Lake by Lake Profiles
Lake Superior
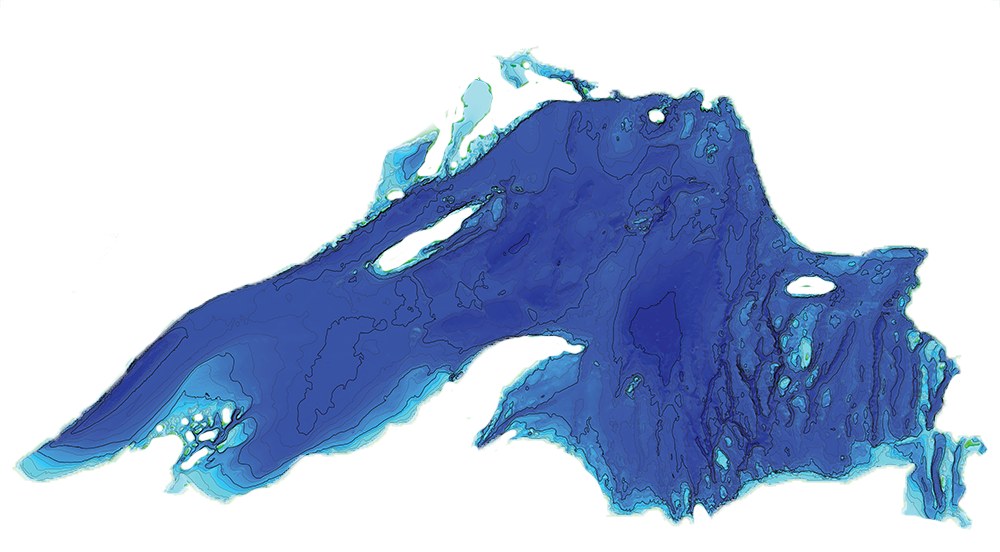
Lake Superior is the largest of the Great Lakes
and ranks as the second largest lake in the world (by surface area).
Lake Superior Basin Statistics
| Length |
350 mi / 563 km |
| Breadth |
160 mi / 257 km |
| Depth |
489 ft / 149 m average
1,333 ft / 406 m maximum |
| Shoreline Length |
2,730 miles / 4393 km (including islands) |
| Volume |
2,935 cubic mi
12,232 cubic km |
| Water Surface Area |
31,700 square miles
82,097 square km |
| Retention/Replacement Time |
173 years |
| Outlet |
St. Marys River to Lake Huron
Levels regulated by international agreements |
Source: Lake Superior Basin statistics map produced
by Michigan Sea Grant/Michigan State University Extension (2000).
|
| Food Web Diagram |
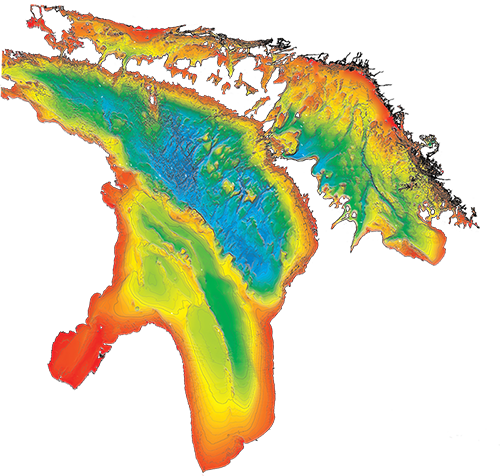
Lake Michigan
Lake Michigan is
the third largest of the Great Lakes and ranks as the fifth
largest lake in the world (by surface area).
Lake Michigan Basin Statistics
| Length |
307 mi / 494 km |
| Breadth |
118 mi /190 km |
| Depth |
279 ft / 85 m average
923 ft / 281 m maximum |
| Volume |
1,180 cubic mi /
4,918 cubic km |
| Shoreline Length |
1,640 mi
/ 2,639 km (including islands) |
| Water Surface Area |
22,300 square mi /
57,753 square km |
| Retention/Replacement Time |
62 years |
| Outlet |
Straits of Mackinac to Lake Huron |
Source: Lake Michigan Basin statistics map produced
by Michigan Sea Grant/Michigan State University Extension (2000).
The Lake Michigan Basin bathymetry
map was produced by NOAA (GLERL and National
Geophysical Data Center).
Quinn, F.H., 1992. Hydraulic residence times for the Laurentian Great Lakes. Journal of Great Lakes Research, 18(1), pp.22-28.
(View PDF)
|
| Food Web Diagram |
Lake Huron
Lake Huron is the second largest of the Great
Lakes and ranks as the fourth largest lake in the world (by surface area).
Lake Huron Basin Statistics
| Length |
206 mi / 332 km |
| Breadth |
183 mi / 295 km |
| Depth |
195 ft / 59 m average
750 ft / 229 m maximum |
| Volume |
849 cubic mi
3,538 cubic km |
| Shoreline Length |
3,830 mi
6,164 km (including islands) |
| Water Surface Area |
23,000 square mi
59,565 square km |
| Retention/Replacement Time |
21 years |
| Outlet |
St. Clair River to Lake St. Clair to the Detroit River to Lake Erie |
Source: Lake Huron Basin statistics map produced
by Michigan Sea Grant/Michigan State University Extension (2000).
The Lake Huron Basin bathymetry
map was produced by NOAA (GLERL and National
Geophysical Data Center). |
| Food Web Diagram |
Lake Erie
Lake Erie is
the fourth largest of the Great Lakes and ranks as the 13th
largest lake in the world (by surface area).
Lake Erie Basin Statistics
| Length |
241 mi / 388 km |
| Breadth |
57 mi / 92 km |
| Depth |
62 ft / 19 m average
210 ft / 64 m maximum |
| Volume |
116 cubic mi
483 cubic km |
| Shoreline Length |
871 mi
1,402 km (including islands) |
| Water Surface Area |
9,910 square mi
25,655 square km |
| Retention/Replacement Time |
2.7 years |
| Outlet |
Niagara River and Welland Canal |
Source: Lake Erie Basin statistics map produced
by Michigan Sea Grant/Michigan State University Extension (2000).
The Lake Erie Basin bathymetry map
was produced by NOAA (GLERL and National
Geophysical Data Center). |
| Food Web Diagram |
Lake Ontario
Lake Ontario is
the fifth largest of the Great Lakes and ranks as the 17th largest
lake in the world (by surface area).
Lake Ontario Basin Statistics
| Length |
193 mi / 311 km |
| Breadth |
53 mi / 85 km |
| Depth |
283 ft / 86 m average
802 ft / 244 m maximum |
| Volume |
393 cubic mi / 1,639 cubic km |
| Shoreline Length |
712 mi
1,146 km (including islands) |
| Water Surface Area |
7,340 square mi /
19,009 square km |
| Retention/Replacement Time |
6 years |
| Outlet |
St. Lawrence River to the Atlantic Ocean
Levels regulated by international agreements |
| Source: Lake Ontario Basin statistics map produced
by Michigan Sea Grant/Michigan State University Extension (2000).
The Lake Ontario Basin bathymetry
map was produced by NOAA (GLERL and National
Geophysical Data Center). |
| Food Web Diagram |
Bathymetry data products, such as posters and CD-ROMs, are
available to order through the NOAA
National Geophysical Data Center web site.
|