
NOAA - Great Lakes Environmental Research Laboratory

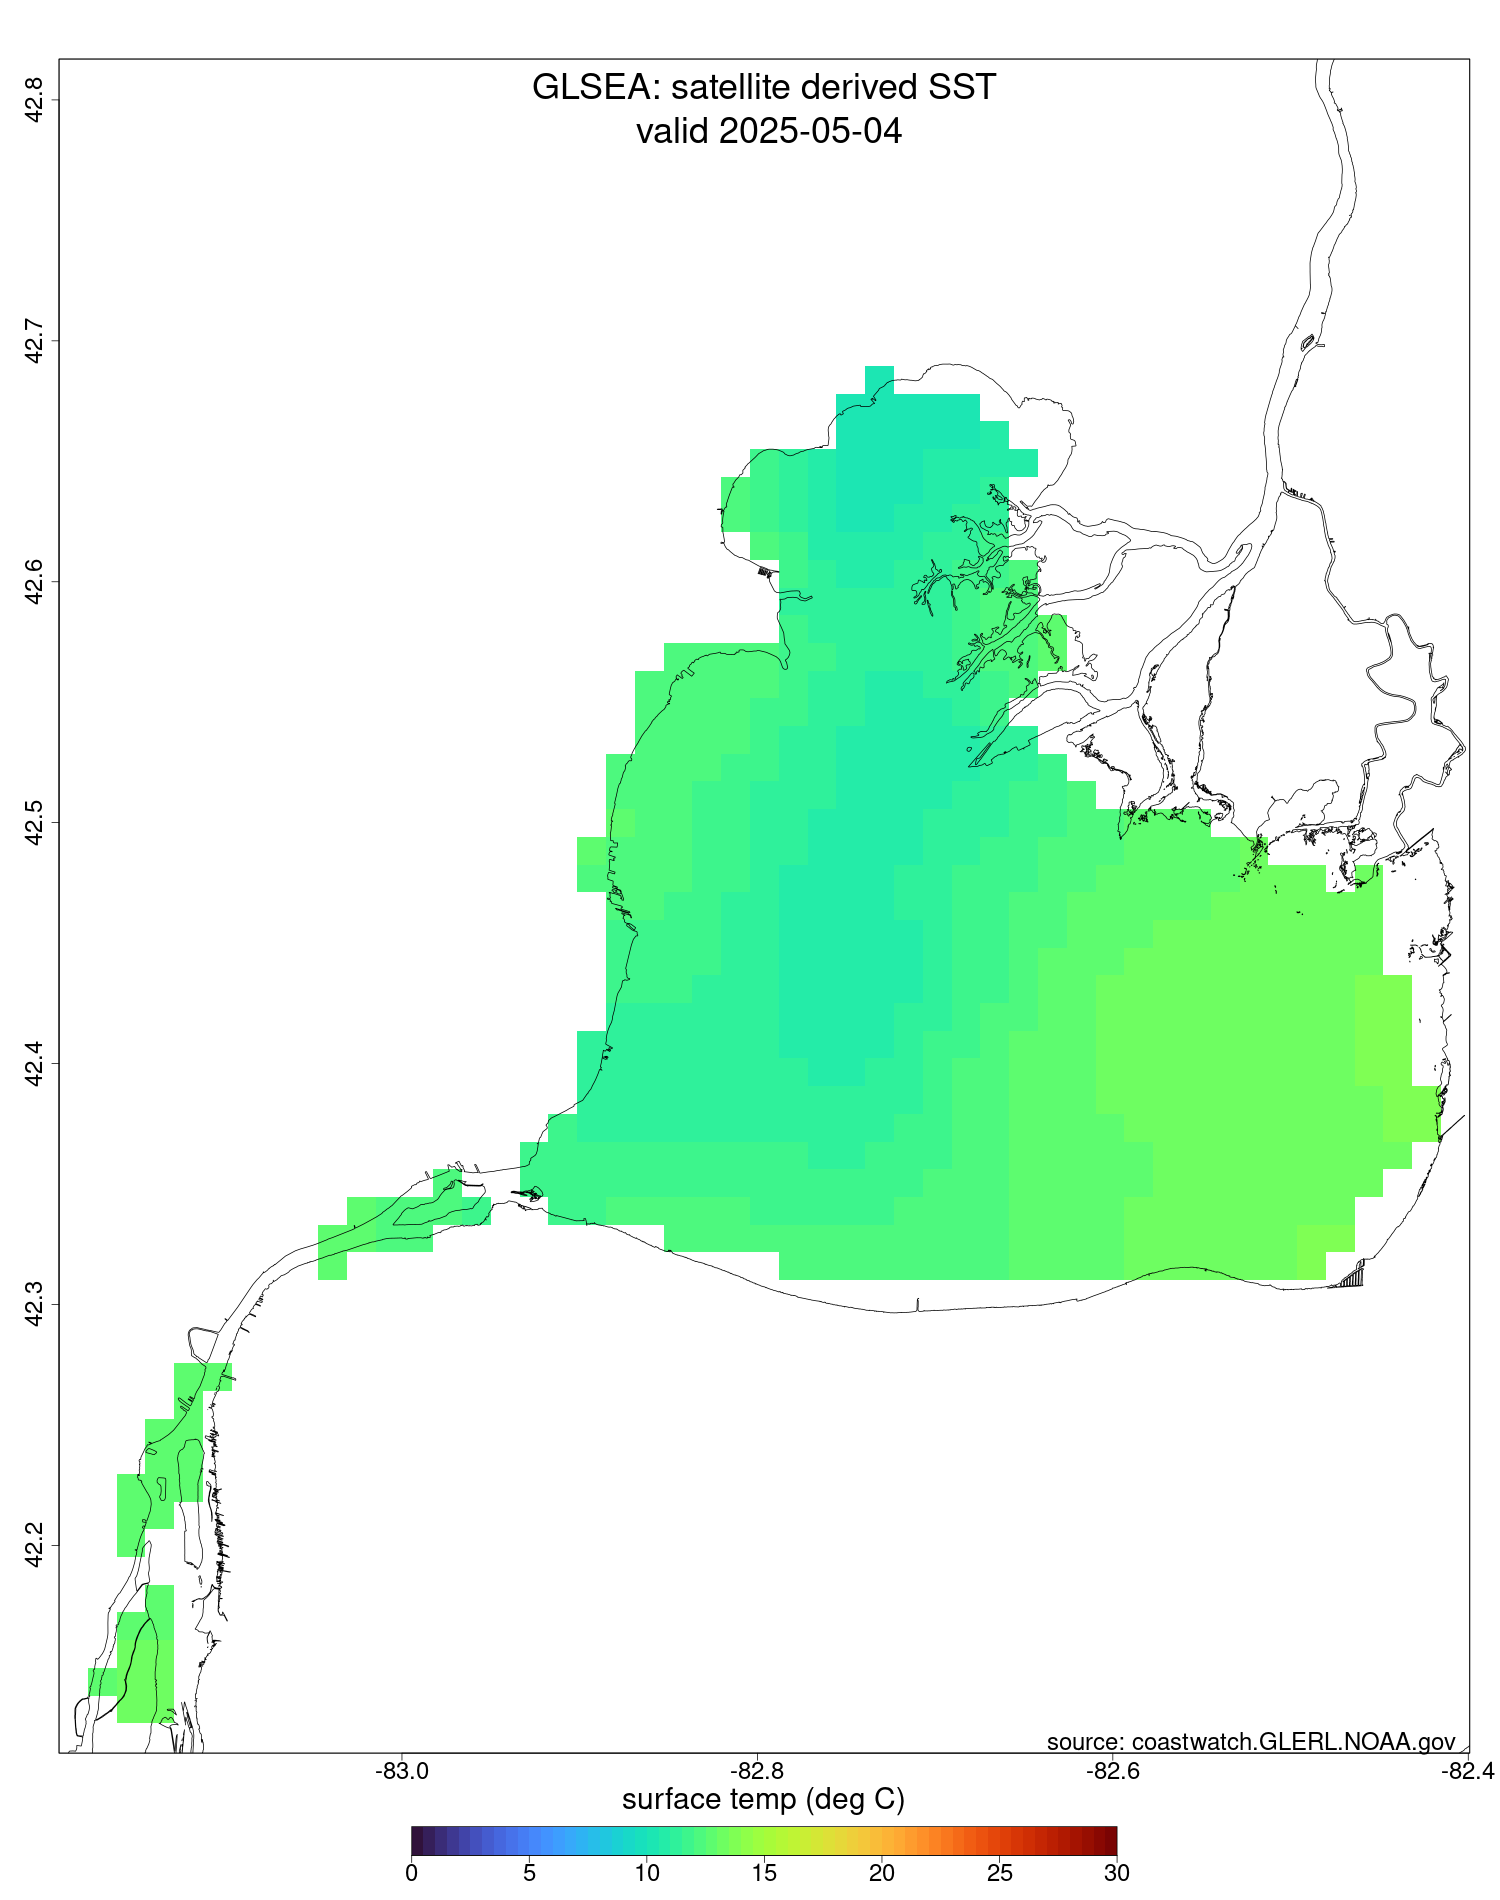
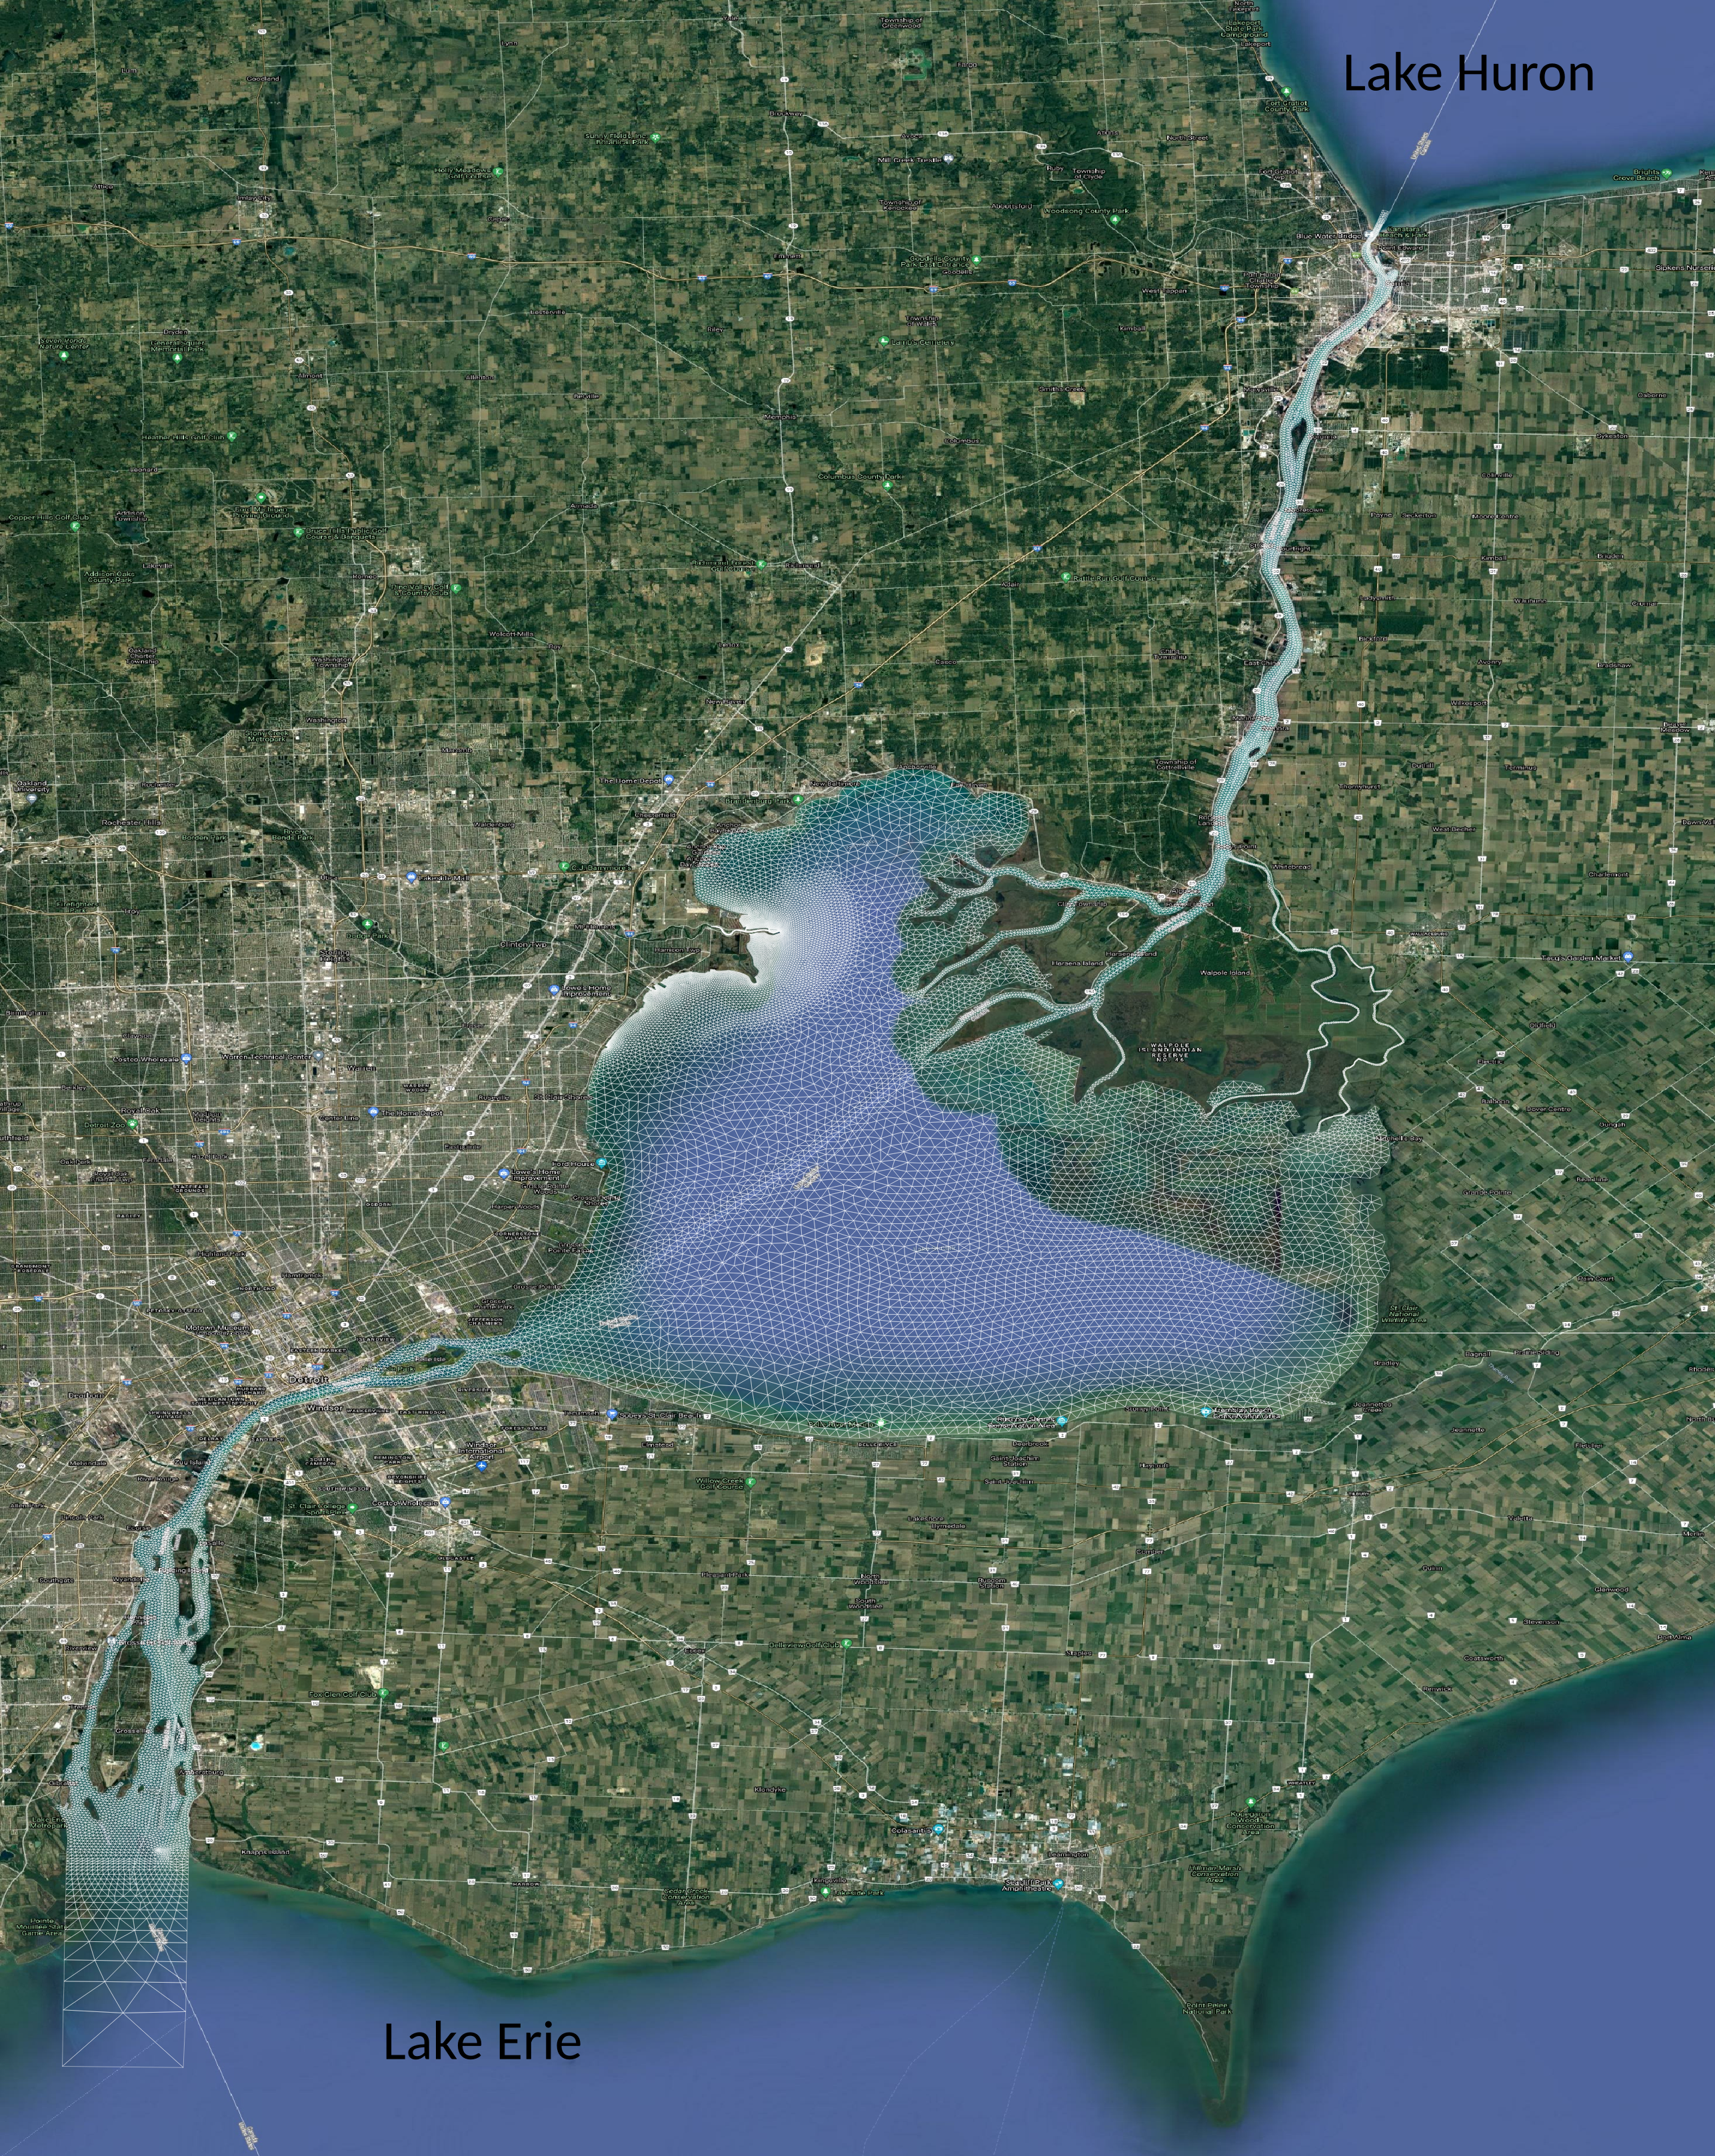
Huron-Erie Corridor Forecast System | ||||||||||||||
|
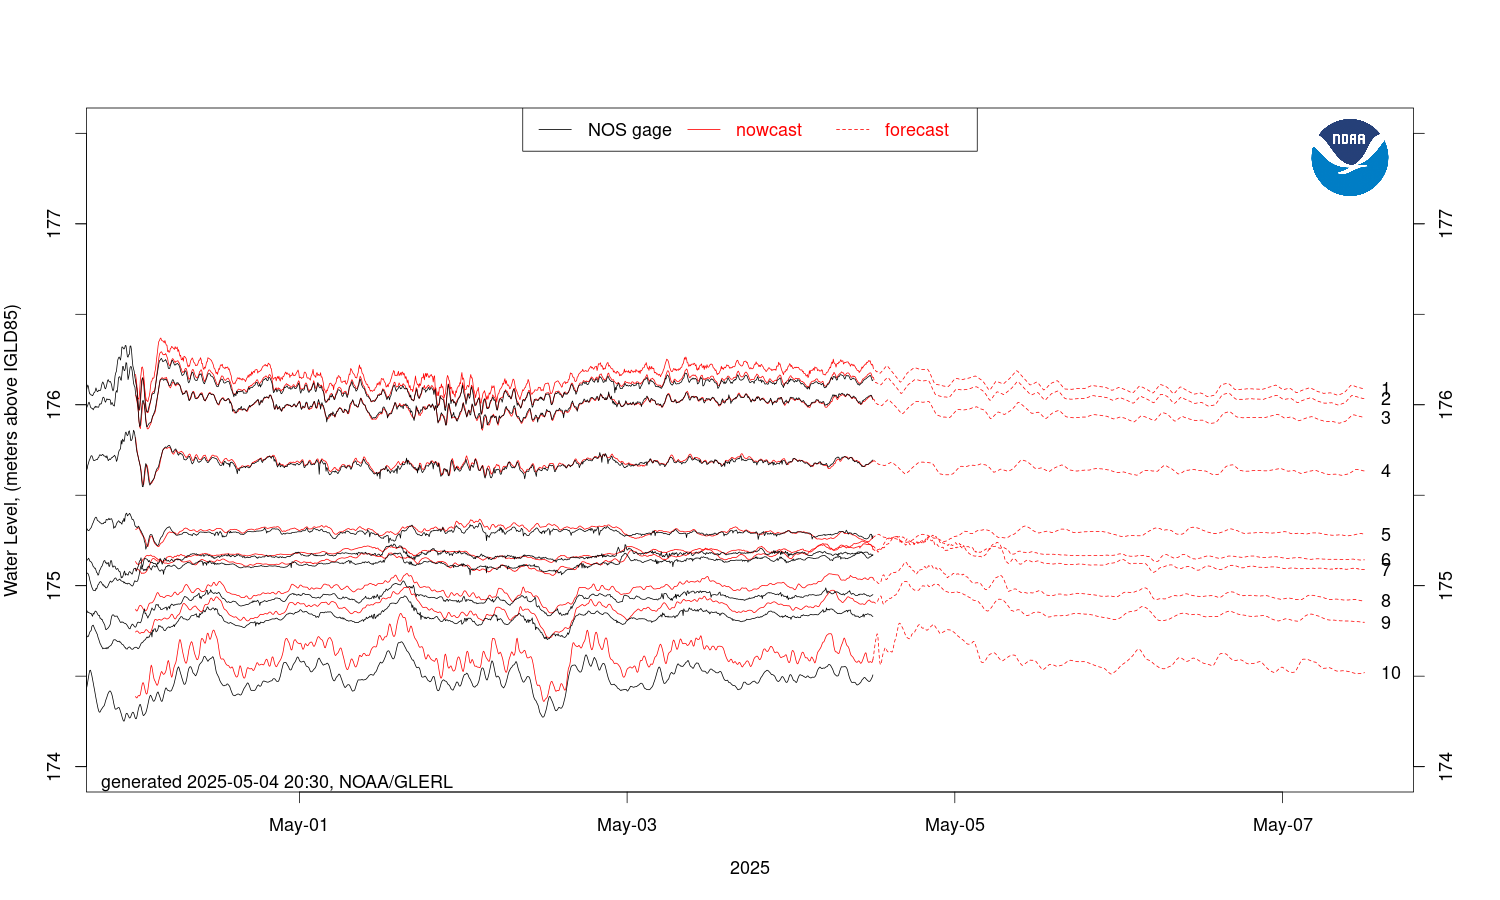
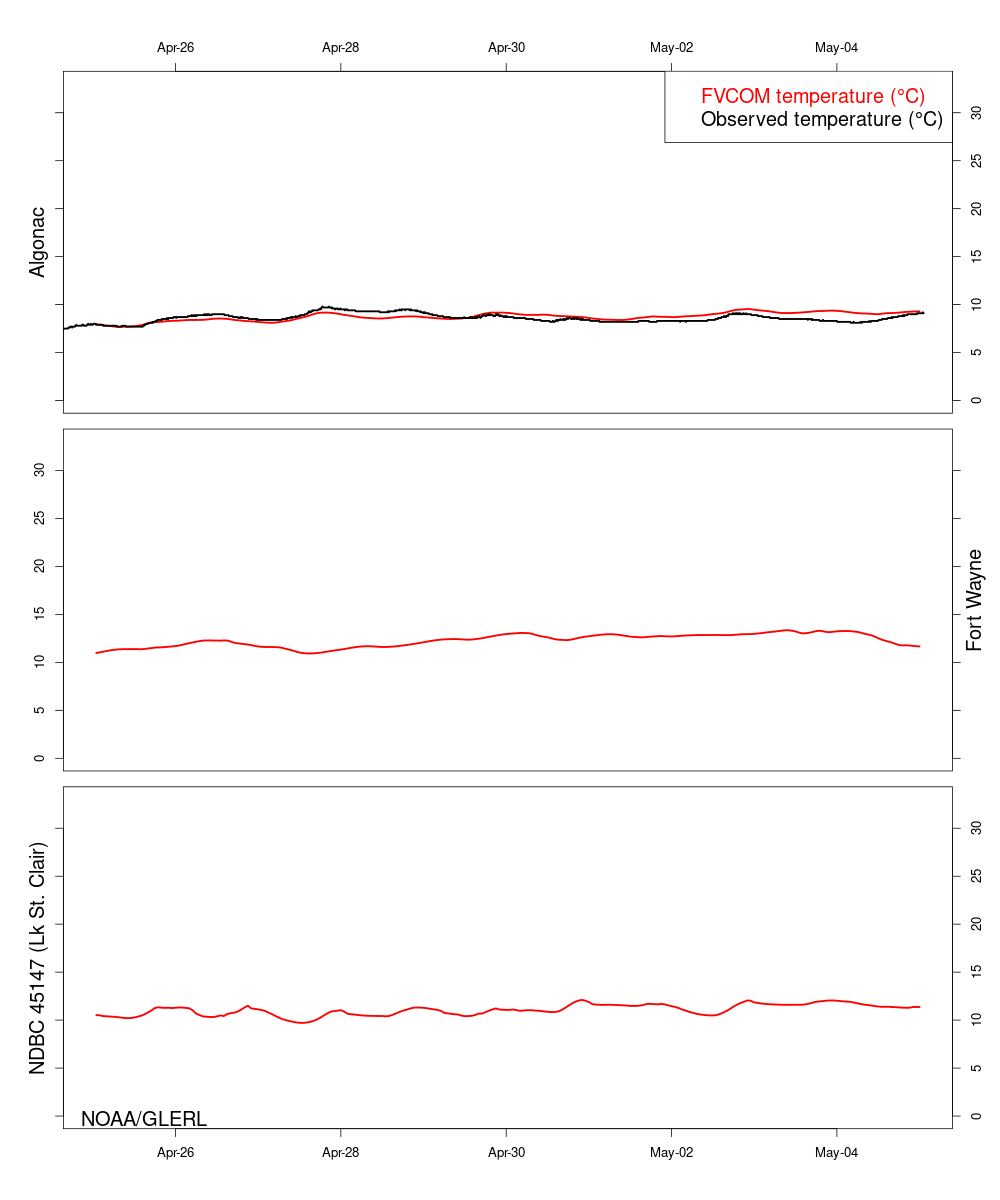
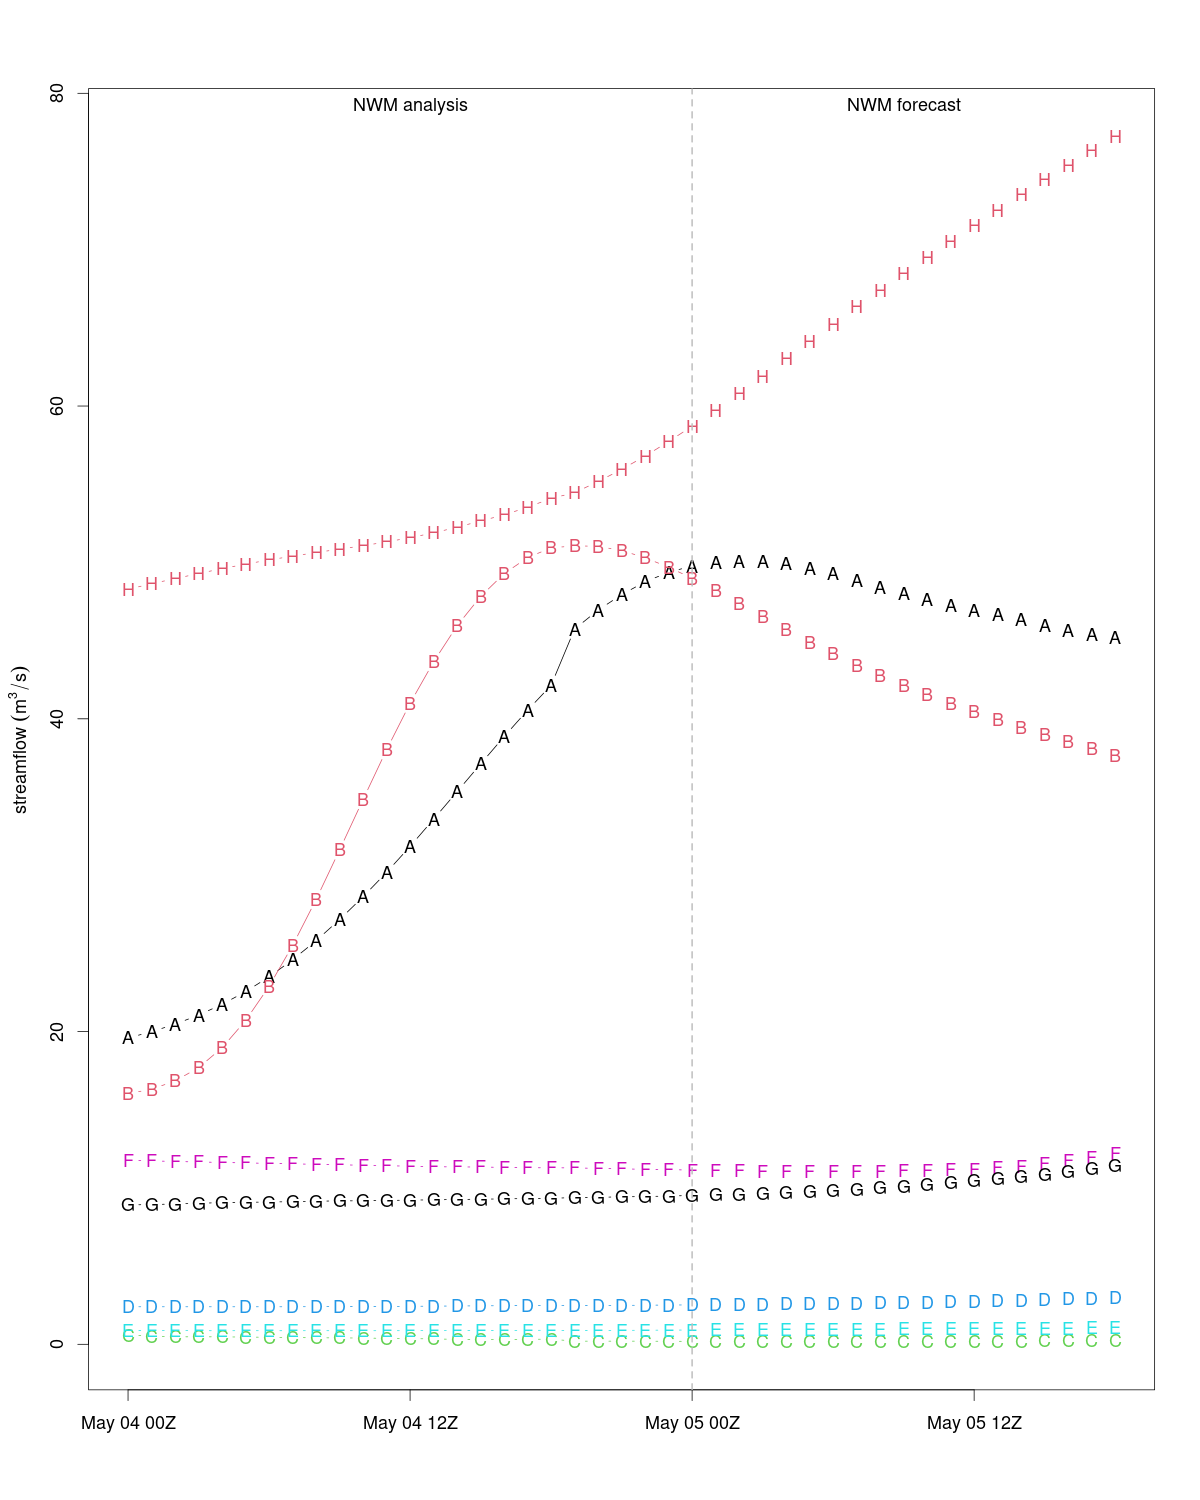
▸ Research to Operations Notice These products are updated 2x per day around 6 and 18 UTC. Note: These simulations DO include representation of ice cover (not shown).
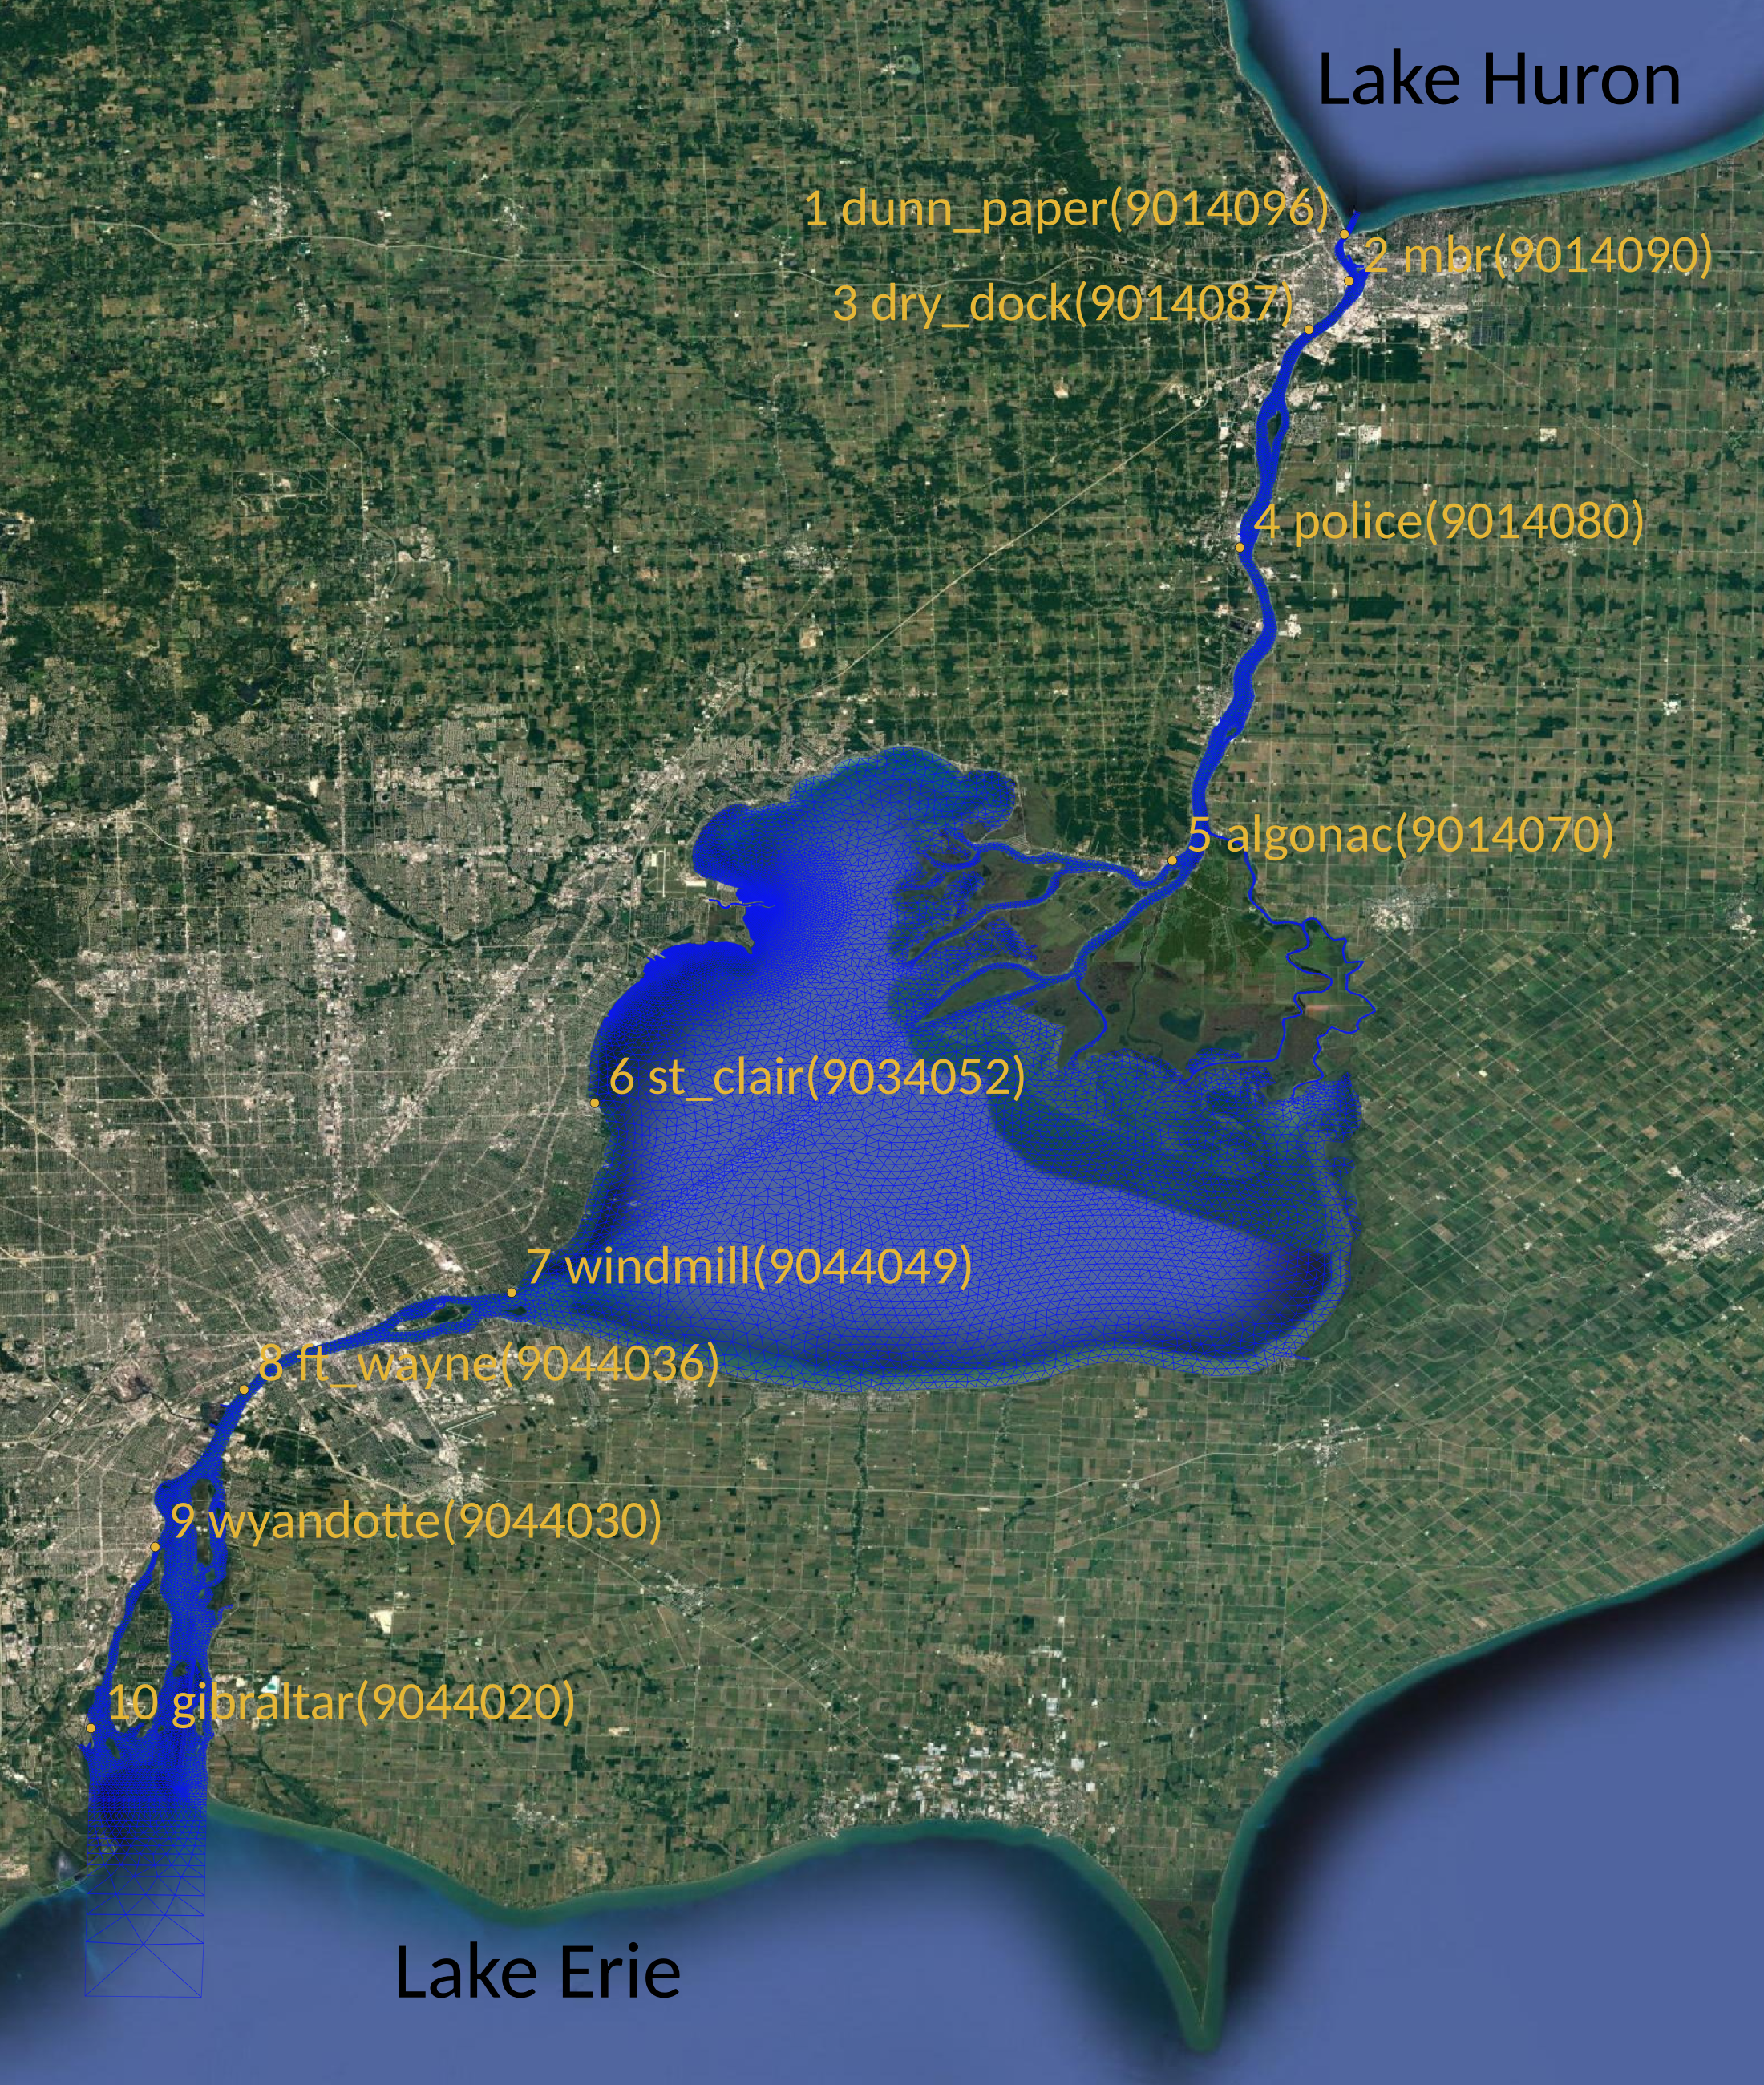
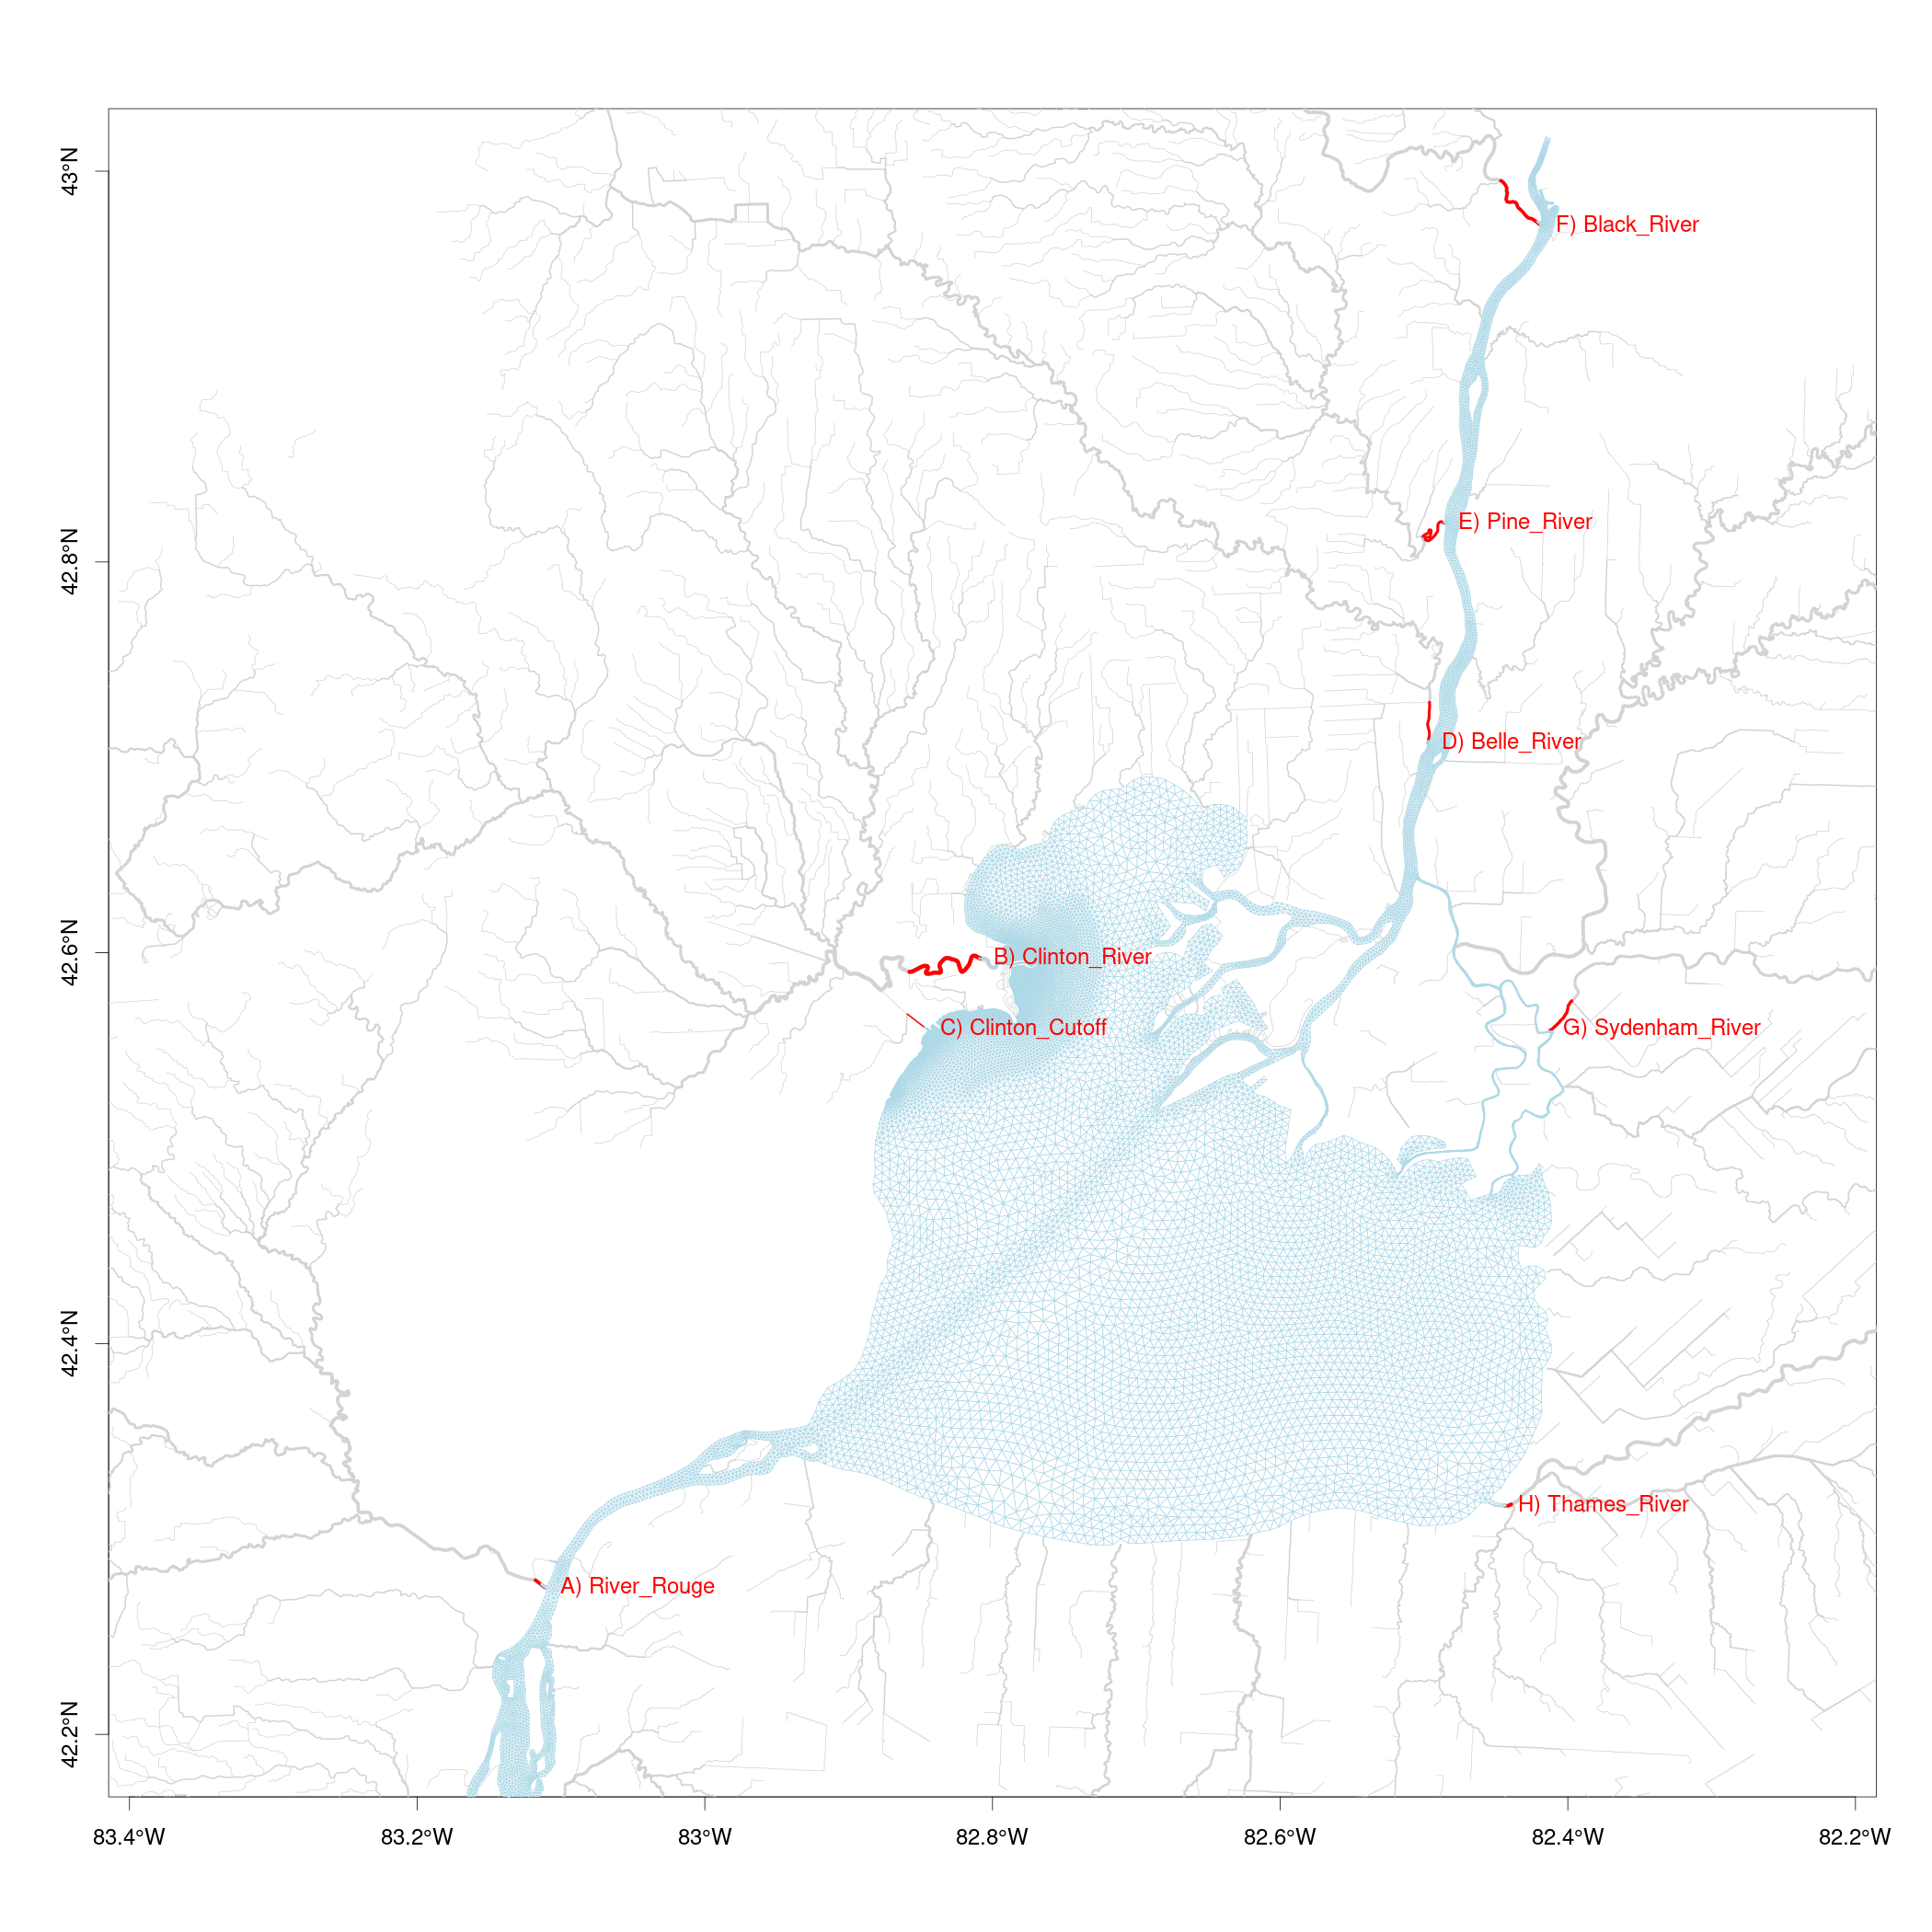
Maps: FVCOM Domain | NOS Gage Map | NWM Flowlines Map |
||||||||||||||
| ||||||||||||||
