Great Lakes water levels have taken a dip over the last few years. Only a few years ago, we were fielding questions related to record high water levels on each of the lakes. Now, as water levels return to near and sometimes even below average, the question arises: why the dramatic shift from very high water levels to the relatively lower water levels we are seeing now?
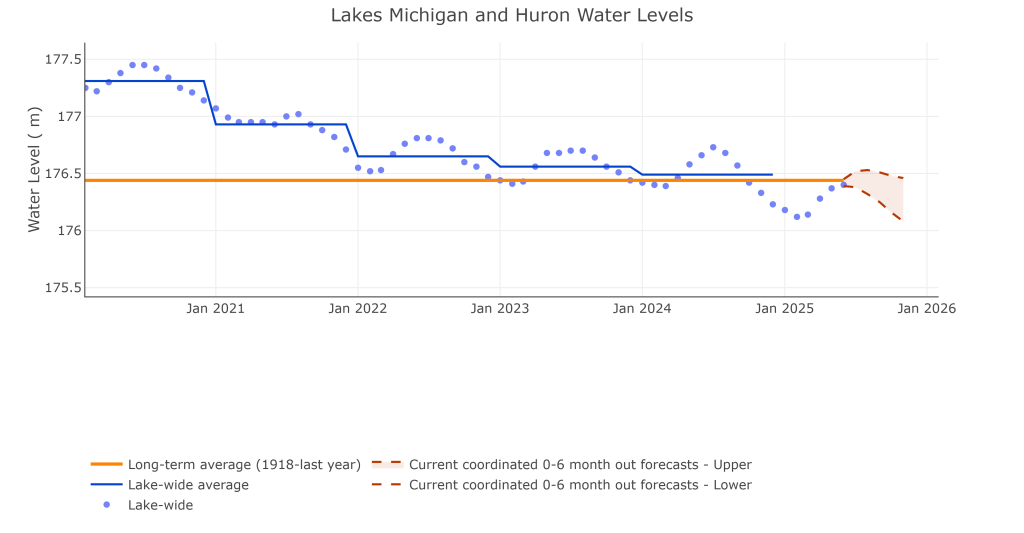
First, it is important to look at the current water levels in the context of the very long historical record of Great Lakes water levels. The historical record, which is officially coordinated by federal agencies in the U.S. and Canada, dates back to 1918. The NOAA Great Lakes Water Level Dashboard is a useful tool to explore this coordinated data. Here is where monthly mean water levels were in May 2025, relative to this long record back to 1918:
- Lake Superior was about 2 inches below last year and almost 4 inches below its long-term average level for May, but about 20 inches above the record low May level. The overall range since 1918 is close to 4 ft.
- Lake Michigan-Huron was about 8 inches below last year and close to 6 inches below its long-term average level for May, but 25 inches above the record low May level. The overall range since 1918 is a little over 6 ft.
- Lake Erie was about 6 inches below last year, but 5 inches above its long-term average level for May and 40 inches above the record low May level. The overall range since 1918 is about 6.5 ft.
- Lake Ontario was about 1 inch above last year, but close to 2 inches below its long-term average level for May. The Lake Ontario May level was about 35 inches above the record low May level. The overall range since 1918 is a little over 7 ft.
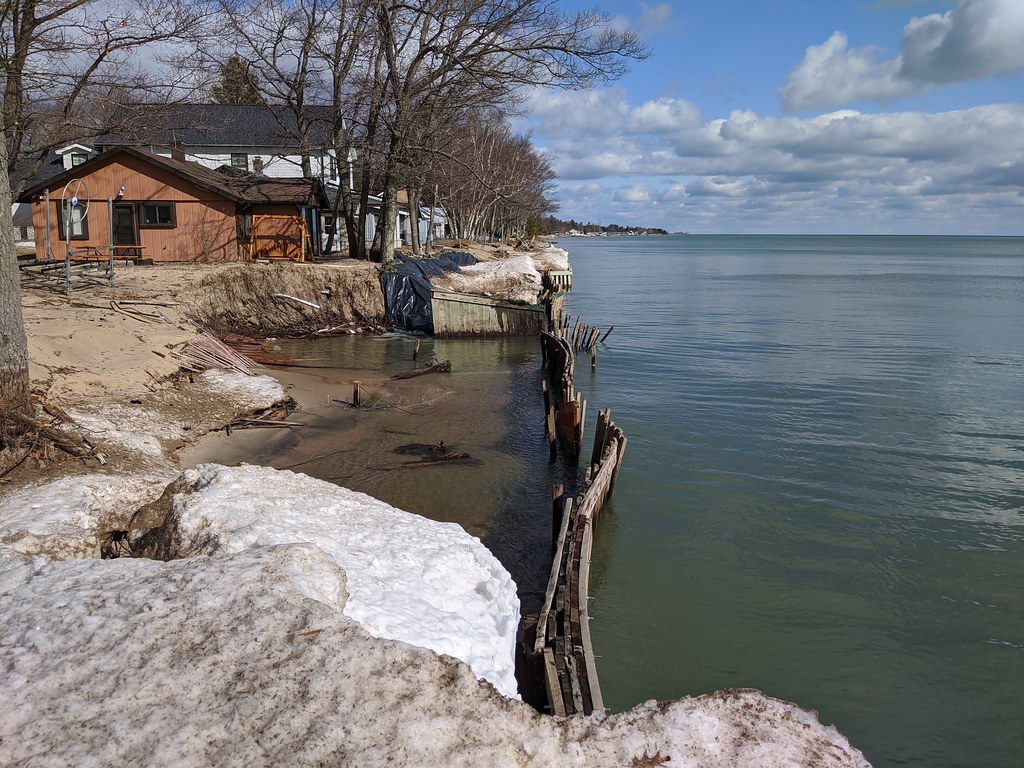
In the context of the long historical record, these recent levels are not so different from long term averages, but what is remarkable is how much change seen in Great Lakes water levels since 2020. We observed record high water levels on each lake at some point between 2017 and 2020. During that period, impacts included coastal flooding and property damage from erosion. When water levels are much below average, on the other hand, impacts include ecosystem changes and loss of wetland area, reduced capacity for shipping drafts, and changes to waterfront access and aesthetics.

Why did water levels come down?
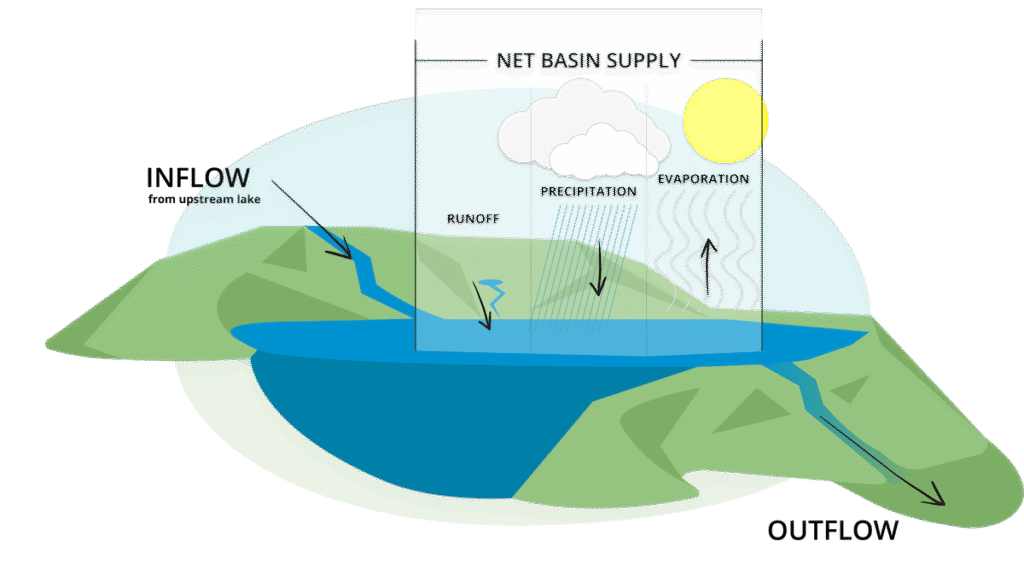
Great Lakes water level changes on seasonal and longer timescales are the result of the combined influence of precipitation falling over the lake, runoff into the lake, and evaporation from the lake surface. We refer to the combination of these three factors as net basin supply (NBS). When the net inflow to a lake is more than the lake outflow, water levels will go up, and vice versa.
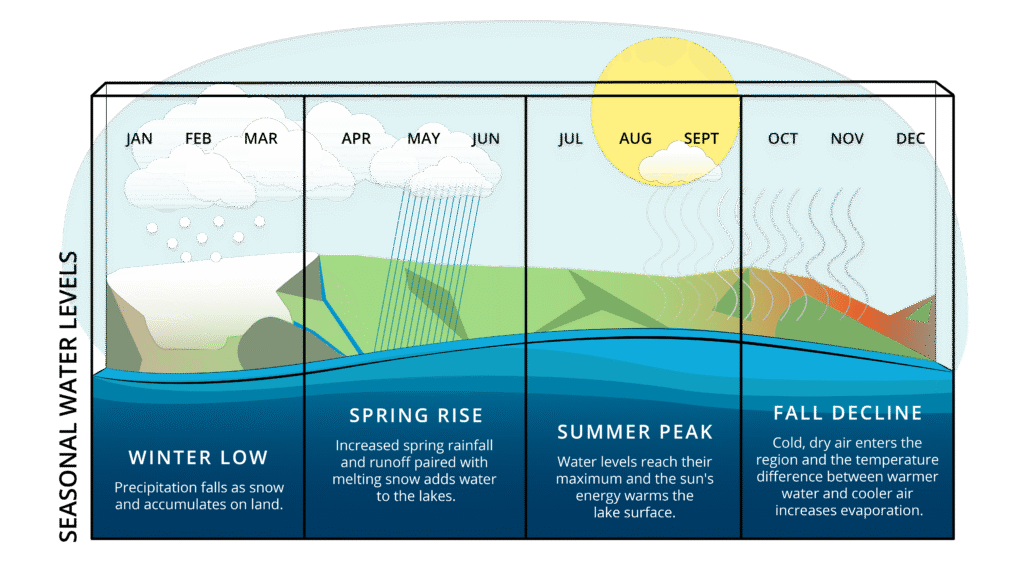
At a seasonal timescale, the lakes generally follow a pattern of lower levels during the winter months and higher water levels during the summer or early fall. During the winter, precipitation falls as snow and accumulates on land. In the spring, melting snow and precipitation falling as rain add water to the lakes, causing water levels to rise. Then, in the fall and early winter, when cold air enters the region, the temperature difference between warmer water and cooler air results in increased evaporation, driving water levels back down for the winter. When we see longer periods of high precipitation and/or low evaporation rates, we can expect increasing water levels, whereas during extended periods of low precipitation and/or high evaporation rates, we can expect water levels to decline.
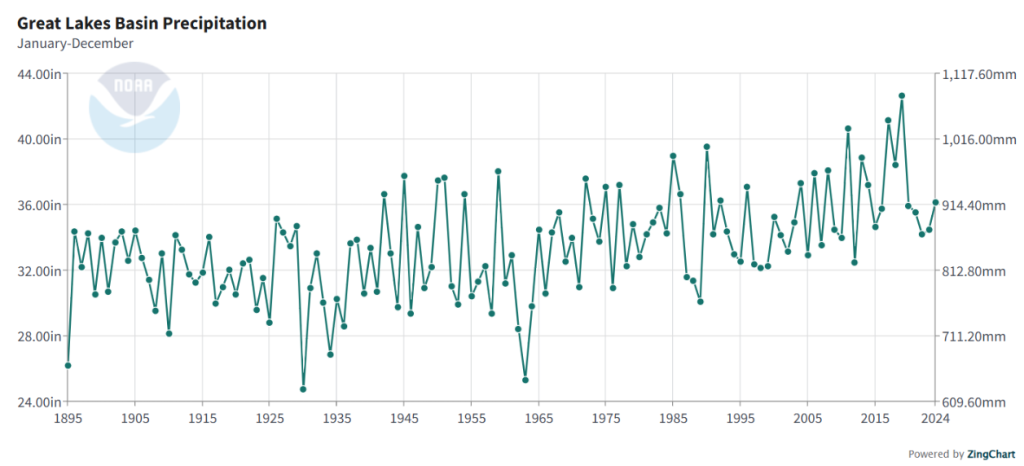
High water levels were sustained over a multi-year period ending in 2020, largely a result of a sequence of years with very high precipitation. In fact, the five years ending in April 2020 were the wettest 5 years on record for the Great Lakes since the late 1890s. After 2020, precipitation was considerably less than during the 5-year period ending in 2020. Below is a graphic of annual precipitation since 1895 from NOAA Climate at a Glance.
GLERL research is advancing seasonal to annual water level forecasts
The NOAA Great Lakes Environmental Research Laboratory (GLERL) hydrology team, including partners from the University of Michigan’s Cooperative Institute for Great Lakes Research (CIGLR), conducts research focused on better understanding and predicting the key factors driving seasonal and longer changes in Great Lakes water levels (primarily precipitation, evaporation, and runoff). The forecast tools produced by the GLERL-CIGLR team contributes to the official 6 month forecast of Great Lakes water levels produced by coordination between the U.S. Army Corps of Engineers and Environment and Climate Change Canada each month. The GLERL-CIGLR team is currently developing a next generation prediction system for subseasonal to annual water supply forecasts. This system will transition to sustained operations at the U.S. Army Corps of Engineers for application to seasonal water level forecast products. This new forecast system is being developed using machine learning approaches to predict subseasonal to annual precipitation, evaporation, and runoff based on the NOAA operational Climate Forecast System. The integration of atmospheric science, hydrology, data science, and research engagement creates a forecast of Great Lakes water levels that meets end user needs.
Resources
NOAA GLERL Great Lakes Water Levels
NOAA Great Lakes Regional Collaboration Network
U.S. Army Corps of Engineers Great Lakes Water Information
Cooperative Institute for Great Lakes Research, Great Lakes Forecasting