
On June 21, 2025 there were numerous social media reports showing dramatic water level changes across Lake Superior, with photos and videos of water at beaches receding to expose dry land over the course of a couple of hours and then rapidly rising again. These rapid water level changes were experienced by coastal communities all around Lake Superior, with reports and images from areas including Munising, Michigan; Thunder Bay, Ontario; Duluth, Minnesota; and Algoma, Ontario. These significant water level fluctuations had notable impacts on boating and shipping, with ships remaining offshore to avoid groundings resulting in delays, vessel docks being damaged and overturned, and small boats being stranded or pushed into docks and slips. However, no injuries have been reported.
NOAA water level data from Lake Superior shows that the storm caused large fluctuation in water levels, triggering a multi-stage event, with an atmospheric pressure-induced meteotsunami, wind-driven storm surge, and strong seiche activity all interacting to generate the extreme water level fluctuations observed on the lake. The strongest impacts were observed in the lake’s southeastern region, around Whitefish Bay and Sault Ste Marie.
Ketzel Levens, meteorologist with the National Weather Service at the Duluth, MN Weather Forecast Office (WFO), stated that a significant weather system transited through the region causing this event.
At NWS Duluth, our primary concern with this event was warning on the initial line of thunderstorms that moved across Lake Superior in the early morning hours of June 21, which were producing strong winds and hazardous to mariners. Once the line of storms had passed, we were monitoring for reports of large hail or wind damage when we were alerted to large water level fluctuations occurring in Ashland, WI along with subsequent minor flooding in the Maslowski Beach area. Seiche and meteotsunami events can be difficult to message, due to their displacement in timing from the convective system that initiates them, as well as a sparse data network to actually track water level fluctuations so some events may go un-observed, especially if they are nocturnal. We also don’t have a specific headline to issue for these events, though depending on the severity level they might fit under Lakeshore Flood Advisory or Special Marine Warning. Additionally, we don’t get events of this magnitude as frequently as some of the southern Great Lakes, though low magnitude seiches kicked off by synoptic weather systems are common. Thus, we put out a call for reports in order to better understand the impacts being felt around Lake Superior, and try to tie those to the few water level sensors that do exist as well as the timing of the storm system. Reports poured in, with significant water level fluctuations observed around Lake Superior that caused water to pull out of harbors and then come back in and flood over docks. It also produced a strong current in and out of the Duluth Harbor Canal, with observed flows up to 8 feet/second from the USGS gauge! That current led to chaotic wave action at the mouth of the canal leading to some hazardous conditions for mariners. These reports along with archived weather and water station data will allow an internal team to perform operational research on the event, hopefully making for more efficient pattern recognition in the future! Additionally, due to the quick nature of these events, even high resolution models that have 1-hour granularity may not be able to capture them. More warn-on forecast systems with higher temporal granularity could be helpful in identifying events as well as performing post event analysis.

NOAA Water Level Station 9099004 in Point Iroquois, MI (https://tidesandcurrents.noaa.gov/stationhome.html?id=9099004).
NOAA operates five water level stations on Lake Superior, which are used to monitor, track, and understand lake processes such as the extreme fluctuations experienced by coastal communities this weekend. The Point Iroquois water level station (9099004) is situated on Whitefish Bay in southeastern Lake Superior in Michigan’s Upper Peninsula, and has recorded water level measurements every 6 minutes since September 1995. On June 21, 2025, this station recorded a remarkable 45 inch increase in water level in Whitefish Bay over less than 2.5 hours, the largest water level surge ever recorded in the station’s 30-year history.
The water level fluctuations began with a low pressure system that moved from west to east across Lake Superior between approximately 6:00 AM and 10:00 AM EDT on June 21. As a strong, low pressure storm moves across the lake, air pressure differences cause it to push down unevenly on the lake surface, which raises water levels with the storm’s passing. Under certain conditions, this displacement can result in the formation of large-scale waves known as meteotsunami. Meteotsunami happen regularly on the Great Lakes, forming when a storm is moving in the same speed and direction as the wave that’s building in front of it. This amplifies the wave, and as the wave reaches the shore, it produces a sudden rise in water level. As the June 21 storm moved west to east across Lake Superior, it produced a significant meteotsunami in eastern Lake Superior, and a water level rise of 19.3 inches between 8:00 AM and 9:48 AM was recorded at the Point Iroquois station as a result.

At the tail end of the passing storm, eastern Lake Superior experienced strong sustained winds out of the south-southeast. NOAA’s Eastern Lake Superior Buoy (45004) recorded sustained winds of up to 20 to 35 mph with gusts up to 40 mph between approximately 9:00 AM and 1:00 PM.
These strong winds produced a wind-driven storm surge, driving water to surge back out to the northern and western portions of the lake and away from the southern shore. The magnitude of wind-driven storm surges on the Great Lakes depends on both the speed of the wind and the distance it has to travel over the lake and build momentum, known as “fetch”. The strong south winds experienced in eastern Lake Superior produced a storm surge on the north-northwest shore, which was amplified both by lingering low pressure to the north, and because the lake was primed by the meteotsunami that had immediately preceded it. Additionally, there was a water level drop of -43.3 inches between 9:48 AM and 11:24 AM associated with the storm surge recorded at the Point Iroquois station. As the storm finished moving through and conditions on Lake Superior calmed, the displaced lake surface rebounded to produce strong seiche activity, with a water level rebound of +45.4 inches from 11:24 AM to 1:41 PM.

The 45.4 inch water level rise observed on June 21 was the highest-magnitude surge ever observed at the Point Iroquois station, which has continuous data dating back to September 1995. In fact, surges above 36 inches have only occurred on four other days in the station’s 30-year record, most recently a 42.3 inch magnitude surge that occurred on June 29, 2018. This makes the June 21 event quite uncommon and remarkable in its magnitude and complexity

A seiche is the oscillation of water back and forth across a large body of water that can continue for several days. The Great Lakes can act like giant bathtubs, with water sloshing back and forth after being pushed around by a storm. Lake Superior’s size and shape result in it having a characteristic seiche period of appoximately 8 hours, meaning it takes about 8 hours for water to slosh back and forth across the lake (e.g., between Duluth and Sault Ste. Marie). Seiche activity is almost always present on Lake Superior. Under typical conditions, seiche fluctuations are only a few inches in magnitude, but when triggered by a strong storm, they can be much larger. On June 21, the initial rebound observed in Whitefish Bay likely occurred primarily within the lake’s eastern basin, thus explaining its shorter period, then relaxing to a more typical east-west lakewide seiche with a roughly 8-hour period in subsequent oscillations.

With a strong trigger like the June 21 storm, elevated seiche activity can persist for several days following the initial event. Seiche fluctuations exceeding 18 inches continued throughout the following day, and elevated seiche activity persisted on the lake through June 25, several days after the initial event.
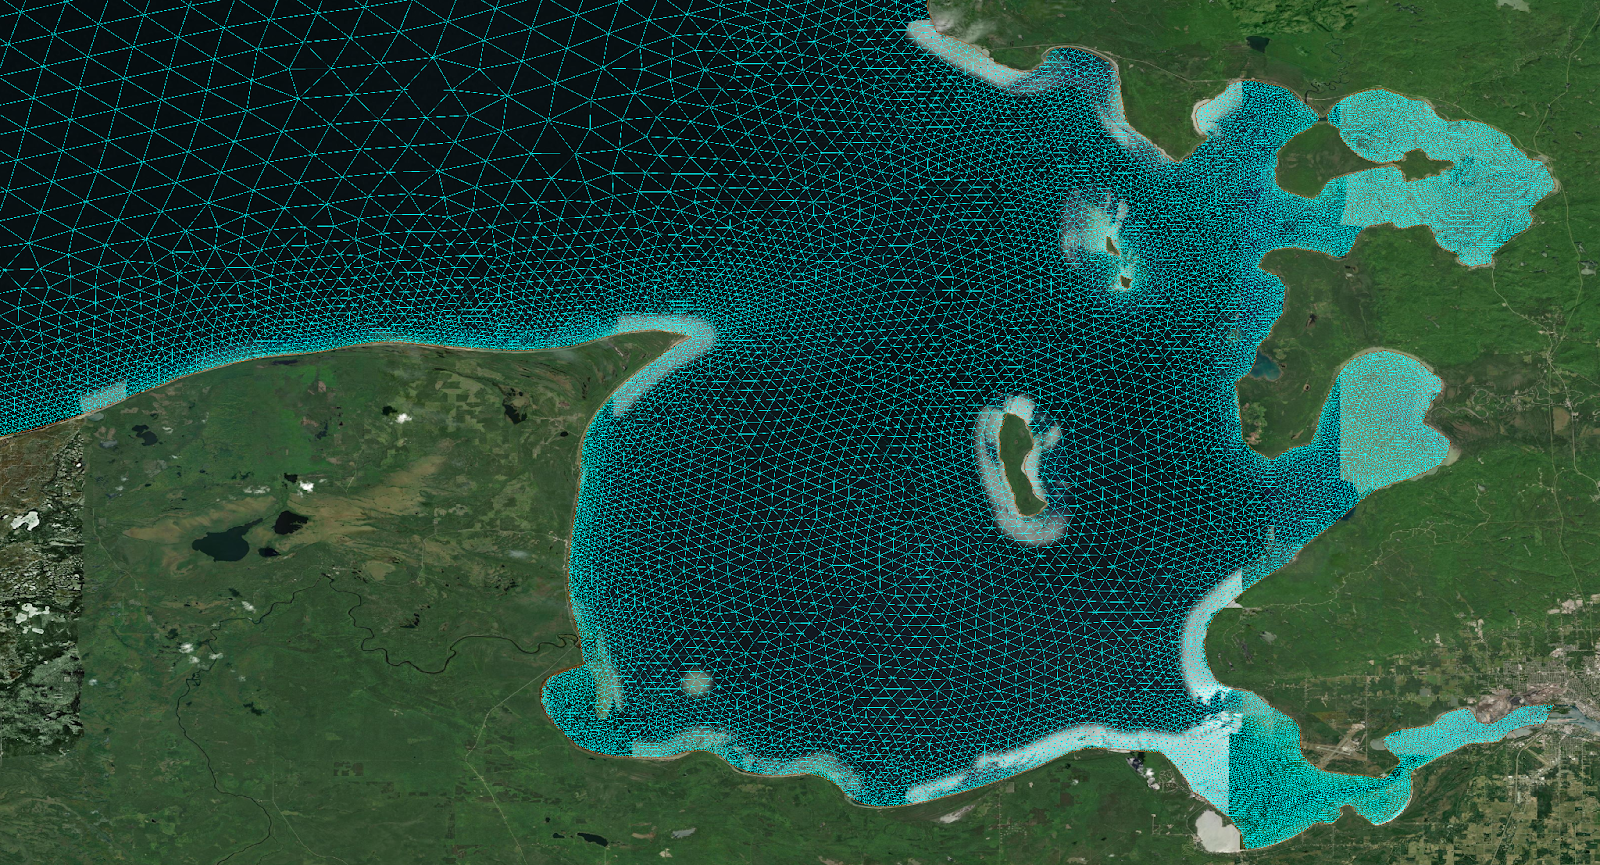
Scientists at NOAA’s Great Lakes Environmental Research Laboratory (GLERL) are now working to understand exactly how water moved around the lake on that day. Existing Great Lakes forecast models, such as the Lake Superior FVCOM Forecast System are capable of simulating and forecasting many key processes in the lakes, such as currents and storm surges. However, fast moving squall lines, such as those that move across the lake to produce meteotsunami, often evolve too quickly to be fully represented in the hourly data generated by these models. Continued research and development of Great Lakes forecast models will be critical to understanding, simulating, and forecasting events like the June 21 storm’s impact on Lake Superior.