NOAA Great Lakes Environmental Research Laboratory Blog

The latest news and information about NOAA research in and around the Great Lakes

October 4, 2016
by Nicole Rice
1 Comment

Retrieval of new data from instruments in Manistique River will inform research and decision making

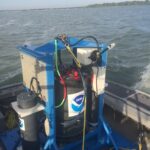
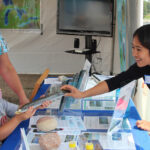
During recent fieldwork, Dr. Philip Chu, scientist at NOAA’s Great Lakes Environmental Research Laboratory (GLERL) and Professor Chin Wu, from the University of Wisconsin Madison, retrieved six water level sensors and one Acoustic Doppler Current Profiler (ADCP) from the Manistique River—a 71.2 mile long river in the Upper Peninsula of Michigan that drains into Lake Michigan.

An ADCP measures water currents with sound by using the Doppler effect— sound wave has a higher frequency, or pitch, when it moves toward you than it does when it moves away. Think of the Doppler effect in action the next time you hear a speeding train pass you by. As the train moves toward you, the pitch of its whistle will be higher. As it moves away, it will be lower. The same effect happens as sound moves through water. The ADCP emits pulses of sounds that bounce off of particles moving through the water. Particles that are moving toward the sensor will produce a higher frequency than those moving away from the sensor. This effect allows the profiler to record data about sediment transport in the river.

After quality control and assurance procedures back in the lab, currents and water level data collected during this deployment, scientists will use the information to research the impacts of meteotsunamis, seiches, and flooding events on sediment transport through the river. The outcomes of this research will then will be used by organizations, such as the U.S. Army Corps of Engineers, for dredging operations on the river with the ultimate goal of improving water quality. (See the Great Lakes Water Quality Agreement for more on why the Manistique River is considered an “Area of Concern.”)

In addition, researchers will use this valuable field data while validating the NOAA next generation Lake Michigan-Huron Operational Forecasting System, one of the forecast systems within the Great Lakes Operational Forecasting System, or GLOFS. GLOFS is a prediction system that provides timely information to lake carriers, mariners, port and beach managers, emergency response teams, and recreational boaters, surfers, and anglers through both nowcast and forecast guidance.


Nowcast vs. Forecast: What’s the difference?

A nowcast is a description of the present lake conditions based on model simulations using observed meteorology. Nowcasts are generated every 6 hours and you can step backward in hourly increments to view conditions over the previous 48 hours, or view animations over this time period.

A forecast is a prediction of what will happen in the future. Our models use current lake conditions and predicted weather patterns to forecast the lake conditions for up to 5 days in the future. These forecasts are run twice daily, and you can step through these predictions in hourly increments, or view animations over this time period.


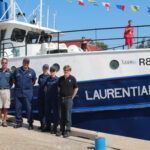
Professor Wu, along with Dr. Eric Anderson from GLERL, deployed these sensors earlier this summer. As with the majority of GLERL’s projects, this is a collaborative effort. Through the Cooperative Institute for Limnology and Ecosystems Research (CILER), this work is supported by NOAA National Marine and Fishery Service and funded by EPA Great Lakes Restoration Initiative. The University of Wisconsin is one of ten CILER Consortium partners.

September 13, 2016
by sonia joshi
Comments Off on Analyzing Algal Toxins in Near Real-Time

Analyzing Algal Toxins in Near Real-Time

This morning, along side our partners at the University of Michigan’s Cooperative Institute for Limnology and Ecosystems Research (CILER), we deployed the very first Environmental Sample Processor (ESP) in a freshwater system.

An ESP is an autonomous robotic instrument that works as a ‘lab in a can’ in aquatic environments to collect water samples and analyze them for algal toxins. This allows for near real-time (only a couple of hours for remote analyzation as opposed to a day or more back at the lab) detection of harmful algal blooms (HABs) and their toxins. GLERL’s ESP—named the ESPniagara—will measure concentrations of Microcystin, the dominant algal toxin in the Great Lakes. It will also archive samples, allowing us to genetically detect Microcystis, the predominant HAB in the Great Lakes, back in the laboratory.

There are 17 ESPs throughout the world and the ESPniagara is the only one (so far) being used in freshwater. We’ve placed it near the Toledo drinking water intake in western Lake Erie to collect and analyze water and detect concentrations of toxins that may be a health risk to people swimming, boating or drinking Lake Erie water. We’ll post the data from the on our HABs and Hypoxia webpage  so that drinking water managers and other end users can make water quality/ public health decisions.

The goal of this research is to provide drinking water managers with data on algal toxicity before the water reaches municipal water intakes. ESPniagara will strengthen our ability to both detect and provide warning of potential human health impacts from toxins.

This research proves to be a great collaborative effort for GLERL, CILER, and our partners. The Monterey Bay Aquarium Research Institute (MBARI) first developed the ESP, which is now commercially manufactured by McLane Laboratories. GLERL purchased the ESPniagara with funding from EPA-Great Lakes Restoration Initiative. NOAA-National Centers for Coastal Ocean Science (NCCOS) developed the technology to detect Microcystins (an ELISA assay). NCCOS funding also supported previous work to demonstrate the viability of ESP technology to assist in monitoring and forecasting of HABs and their related toxins in the marine environment.

We plan to have the ESPniagara out in western Lake Erie for the next 30 days. Check back later this week and next for a few videos, photos, and some pretty cool data. For more information, check out our HABs and Hypoxia website and read up on the ESP.

August 18, 2016
by Kaye LaFond
1 Comment

Tracking Changes in Great Lakes Temperature and Ice: New Approaches

In a new study, scientists from GLERL, the University of Michigan, and other institutions take a new look at changing ice cover and surface water temperature in the Great Lakes. The paper, set to be published in Climatic Change, is novel in two ways.

While previous research focused on changes in ice cover and temperature for each lake as a whole, this study reveals how different regions of the lakes are changing at different rates.

While many scientists agree that, over the long term, climate change will reduce ice cover in the Great Lakes, this paper shows that changes in ice cover since the 1970s may have been dominated by an abrupt decline in the late 1990s (coinciding with the strong 1997-1998 winter El Niño), rather than gradually declining over the whole period.

NOAA tracks ice cover and water surface temperature of the Great Lakes at a pretty fine spatial scale. Visit our CoastWatch site and you’ll see detailed maps of surface temperature and/or ice cover updated daily.

However, when studying long-term changes in temperature and ice cover on the lakes, the scientific community has used, in the past, either lakewide average temperature data or data from just a few buoys. We knew how each lake was changing overall, but not much more.

Now, for the first time, researchers are using our detailed data to look at the changes happening in different parts of each lake.

Using GIS (geographic information system) analysis tools, researchers calculated how fast ice cover and temperature were changing on average for each of thousands of small, square areas of the lakes (1.3 km2 for ice cover, and 1.8 km2 for temperature).

The maps below show the results. Changes in ice, on the left, are reported in the number of days of ice cover lost each year. Temperature changes are reported in degrees Celsius gained per year.

Fig3top

Panel a shows the change in seasonal ice cover duration (d/yr) from 1973 to 2013, and panel b shows the change in summer surface water temperature (°C/yr) from 1994 to 2013. Maps from Mason, L.A., Riseng, C.M., Gronewold, A.D. et al. Climatic Change (2016). doi:10.1007/s10584-016-1721-2. Click image to enlarge.

The researchers also averaged these values across major subbasins of the lakes. Maps of those results are below. The color coding is the same, and again, ice cover is on the left while temperature is on the right.

Note: These subbasins aren’t random, and were outlined by scientists as a part of the Great Lakes Aquatic Habitat Framework (GLAHF), which is meeting a need (among other things) for lake study at intermediate spatial scales.

The panel on the left shows the change in seasonal ice cover duration (d/yr) from 1973 to 2013, and the panel on the right shows the change in summer surface water temperature (°C/yr) from 1994 to 2013. Maps created by Kaye LaFond for NOAA GLERL. Click image to enlarge.

Depth, prevailing winds, and currents all play a role in why some parts of the lakes are warming faster than others. A lot of information is lost if each lake is treated as a homogenous unit. With so much variation, it may not make sense for every region of the Great Lakes to use lakewide averages. Studying changes at a smaller scale could yield more useful information for local and regional decision makers.

The second part of the story has to do with how ice cover has changed in the lakes. Previous studies typically represent changes in ice cover as a long, slow decline from 1973 until today (that would be called a ‘linear trend’). However, when looking at the data more carefully, it seems the differences between the 70’s and today in many regions of the Great Lakes are better explained by a sudden jump (called a ‘change point’).

The figure below shows yearly data on ice cover for the central Lake Superior basin. It is overlaid with a linear trendline (the long, slow decline approach) as well as two flat lines, which represent the averages of the data before and after a certain point, the ‘change point’.

Annual ice cover duration (d/yr) for the central Lake Superior basin, overlaid on the left with a linear trend-line, and overlaid on the right with a change-point analysis. Graphic created by Kaye LaFond for NOAA GLERL. Click image to enlarge.

Statistical analyses show that the change point approach is much better fit for most subbasins of the Great Lakes. 

So what caused this sudden jump? Scientists aren’t sure, but the change points of the northernmost basins line up with the year 1998, which was a year with a very strong winter El Niño. This implies that changes in ice cover are due, at least in part, to the cyclical influence of the El Niño Southern Oscillation (ENSO).

All of this by no means implies that climate change didn’t have a hand in the overall decline, or that when there is a cyclical shift back upwards (this may have already happened in 2014) that pre-1998 ice cover conditions will be restored. The scientific consensus is that climate change is happening, and that it isn’t good for ice cover.

This research just asserts that within the larger and longer-term context of climate change, we need to recognize the smaller and shorter-term cycles that are likely to occur.

August 9, 2016
by Kaye LaFond
Comments Off on UPDATE: GLERL Releases Drifter Buoys into Lake Erie

UPDATE: GLERL Releases Drifter Buoys into Lake Erie

Update 08/09/2016: The buoys have drifted ashore and are being collected! The map below shows their full journey.

drifters map 2.1-01.png

This map shows the journey of the drifters from July 5, 2016 to August 5, 2016. Created by Kaye LaFond for NOAA GLERL. Click image to enlarge.


Original post 07/13/2016:

Last week, GLERL scientists released two mobile buoys with GPS tracking capabilities, known as ‘Lagrangian drifters’, into Lake Erie. We are now watching the buoys move around the lake with interest, and not just because it’s fun. The drifters help us test the accuracy of our Lake Erie hydrodynamics model, known as the Lake Erie Operational Forecasting System (LEOFS).

drifters map 2 [Converted]-01.png

This map shows the progress of the drifters as of July 13, 2016 08:19:00. Created by Kaye LaFond for NOAA GLERL. Click image to enlarge.

LEOFS is driven by meteorological data from a network of buoys, airports, coastal land stations, and weather forecasts which provide air temperatures, dew points, winds, and cloud cover.  The mathematical model then predicts water levels, temperatures, and currents (see below).

ewndcur_latest

An example of outputs from the Lake Erie Operational Forecast System (LEOFS)


We use these modeled currents to predict the path that something like, say, an algae bloom would take around the lake. In fact, this is the basis of our HAB tracker tool.

The strength of LEOFS is in how well the modeled currents match reality.  While there are a number of stationary buoys in Lake Erie, none provide realtime current measurements.  The drifters allow us to see how close we are getting to predicting the actual path an object would take.

Researchers will compare the actual paths of the drifters to the paths predicted by our model. This is a process known pretty universally as ‘in-situ validation’ (in-situ means “in place”). Comparing our models to reality helps us to continually improve them.

For more information and forecasts, see our Great Lakes Coastal Forecasting homepage.

For an up-to-date kmz file of the drifters (that opens as an animation in Google Earth), click here.


August 4, 2016
by Katherine Glassner-Shwayder
1 Comment

Happy Birthday to the U.S. Coast Guard – Our Nearest Neighbors in Muskegon

LMFS-USCG_PostCard-Circa1905

Today we would like to wish a Happy 226th Birthday to the U.S. Coast Guard (USCG), with special congratulations to USCG Station Muskegon, our next door neighbors at the Lake Michigan Field Station (LMFS).

map

A modern-day satellite view of the GLERL Lake Michigan Field Station (blue) and the U.S. Coast Guard Station Muskegon (red) facilities. The dark area to the top left is the channel that connects Muskegon Lake (to the right) to Lake Michigan (to the left).

The original U.S. Life Saving Service station was built in 1879 on the north side of the Grand River, with headquarters located about 45 miles southward down the shoreline in Grand Haven. Twenty years later—running the risk of being washed away—the original structure was rebuilt on land that was acquired on the south side of the harbor (between Muskegon Lake and Lake Michigan) where a new station was built between 1904 to 1907.  It is this location at which NOAA assumed ownership of the building from the U.S. Coast Guard in 1990 and where GLERL’s Lake Michigan Field Station stands to this day, as a home for GLERL’s research scientist and staff. The U.S Coast Guard has since built a new facility right next door.

The GLERL field station’s site now includes three buildings, with research vessel dockage next to the main building. Its proximity to Lake Michigan provides support for long-term observations, field work, and experiments that are essential for understanding ecological issues in the Great Lakes and coastal areas.

LMFS_USCG

GLERL’s Lake Michigan Field Station from right to left:”Building 1″ is the former main building for the USGC Station Muskegon. It is now GLERL office space housing the marine superintendent and scientists stationed at LMFS. It also contains a lab area that is used mainly for analyzing fish samples. “Building 2” is for vessel operators who oversee the maintenance and underway periods for vessels. “Building 3” is primarily a laboratory, but it also has a small office space. The U.S. Coast Guard Station Muskegon, and its vessel, can be seen on the left.

We have a strong partnership with the Coast Guard that goes well beyond the comfort of knowing they are close by if we ever run into trouble with one of our research vessels.  Our models and observing systems inform Coast Guard search and rescue missions, we provide scientific and logistical support for Great Lakes spill drills, and we also share resources for engaging with the community.

For more on the history of Lake Michigan Coast Guard stations (and some really cool photos) check out the July 25 M-Live article.

Here is a little more history on the LMFS and some of our own photos as well.

And last, but certainly not least, check out this awesome vintage video clip, originally produced by the Ford Motor Company in 1915, entitled: “Heroes of the Coast Guard,” which features a ton of great footage from the early 1900’s.

#DidYouNOAA: GLERL’s Lake Michigan Field Station is the oldest building owned by NOAA?!

July 22, 2016
by Kaye LaFond
Comments Off on The tricky business of predicting climate change impacts on Great Lakes water levels

The tricky business of predicting climate change impacts on Great Lakes water levels

An early online release of GLERL researcher Brent Lofgren’s paper entitled “Physically Plausible Methods for Projecting Changes in Great Lakes Water Levels Under Climate Change Scenarios” can be found on the American Meteorological Society’s Journal of Hydrometeorology website.

In the paper, Dr. Lofgren and his co-author, Jonathan Rouhana, explore two different ways to model the effects of climate change on evapotranspiration (the movement of water from the land to the atmosphere as the combined result of evaporation and transpiration), and, subsequently, on the water levels of the Great Lakes.

Predicting how climate change will affect the water levels of the Great Lakes is a tricky business. To answer questions like this, it is often best to use models. Modeling is central to what scientists do, both in their research as well as when communicating their explanations. Within their models, scientists study relationships between variables in nature and then apply those relationships to possible future scenarios with one or more tweaked variables.

However, earth systems are so complex and have so many moving parts, that it’s almost impossible to capture them completely in an equation or series of equations. The beauty of modeling, is that it allows scientists to start with a small amount of data and, as time goes on, to build up a better and better representation of the phenomenon they are explaining or using for prediction.

Sometimes, particularly when modeling climate change, problems arise with so-called empirically-based models. Empirically-based models are created by making observations about two or more variables over a certain time period and under certain conditions, and inferring relationships from those observations. Often, those models don’t hold up when conditions change.

An alternative is physically-based models, which use the laws of physics (like conservation of mass, energy, etc.) to make predictions. Complexity is still a hurdle, but the laws of physics hold up no matter what—even when the climate changes.

Dr. Lofgren’s paper details issues with an empirically-based model widely used in Great Lakes research, the Large Basin Runoff Model (LBRM). From the abstract:

This model uses near-surface air temperature as a primary predictor of evapotranspiration (ET); as in previous published work, we show here that its very high sensitivity to temperature makes it overestimate ET in a way that is greatly at variance with the fundamental principle of conservation of energy at the land surface. The traditional formulation is characterized here as being equivalent to having several suns in the virtual sky created by LBRM.

Several suns in the sky – wow! In the most extreme case, this method of calculating evapotranspiration behaves as though there were 565 suns. 

In the context of climate modeling, “The LBRM oversimplifies the physics of the interaction between the earth and the atmosphere,” says Dr. Lofgren.

This doesn’t mean the LBRM isn’t useful in specific instances (e.g. short-term forecasting), or that you shouldn’t ever trust empirically-based models. It just means that different types of models have their place in different circumstances, and that the LBRM probably isn’t the best choice for modeling hydrologic response under climate change conditions.

Scientists often argue about the rightness of their model, and in the process, the model can evolve or even be rejected. Consequently, models are central to the process of knowledge-building.

Scientists who dare to create models know that their models will be scrutinized and tested. Research like Dr. Lofgren’s ensures not only that models are used appropriately with an acknowledgment of their limitations, but that they are continually improved upon.


July 19, 2016
by Nicole Rice
1 Comment

Working to understand the drivers of bloom toxicity in Lake Okeechobee

IMG_0207Last week, GLERL scientist Tim Davis spent time down in Florida sampling and conducting field experiments in Lake Okeechobee and the St. Lucie River, two major freshwater ecosystems in Florida that are currently under a state of emergency due to the presence of harmful algal blooms.

IMG_0197The sampling and research we’re doing in Lake Okeechobeeo helps us get a better understanding of the environmental drivers behind changes in bloom toxicity—a main focus of the research we’re doing within our HAB research program. The work we’re doing throughout western Lake Erie, has led the creation of an experimental Lake Erie HAB Tracker and Lake Erie Experimental HAB forecast, which are used by water treatment managers and others to make important decisions about water quality in the region. 

This collaboration with CILER (Cooperative Institute for Limnology and Ecosystems Research), Stony Brook University and USGS, will prove beneficial to the continued research and better understanding of ecosystem health effects related to human-influenced water quality degradation, not only in the Great Lakes, but throughout all large freshwater systems. By comparing the genetic characteristics of the blooms in Florida to those that occur in Lake Erie, we hope to not only better understand toxicity, but also whether or not we can apply the same techniques of forecasting and monitoring in Lake Erie to other large bodies of freshwater around the world.

GLERL will continue to receive bloom samples for genetic testing of the Lake Okeechobee HAB for the rest of the season.  

Note: For specific information about the bloom in Florida, please visit 
the responding agencies' website: 

For sampling information please visit Florida Department of
Environmental Protection: 
https://depnewsroom.wordpress.com/algal-bloom-monitoring-an
d-response/ 

For health information please visit Florida Department of
Health:
http://www.floridahealth.gov/environmental-health/aquatic-toxins/index.html

For information on water management in the region please
visit South Florida Water Management District:
http://www.sfwmd.gov/portal/page/portal/sfwmdmain/home%20pa
ge 

July 7, 2016
by Kaye LaFond
Comments Off on 2016 Lake Erie HABs Forecast Has Arrived

2016 Lake Erie HABs Forecast Has Arrived

Earlier today, NOAA and partners released their forecast of Harmful Algal Blooms (HABs) for the summer of 2016. The official predicted bloom severity came in at a 5.5, far milder than last year’s 10.5, although still significant.

This spring has been relatively dry, sporting a 4 inch rain deficit since May 2016, and flows in the Maumee River are down. Consequently, the amount of total bioavailable phosphorus flowing into Lake Erie that could feed blooms is lower than the past three years.

This doesn’t mean the source of the nutrients – mainly agricultural runoff – has been addressed. Heavy, intense rainfall in the future could pick up excess nutrients and create severe blooms again.

There is a high uncertainty associated with this summer’s forecast (ranging from 3 to 7) because we don’t know for sure what the overwinter effect from last summer’s bloom is going to be — phosphorous and algae material could remain in the water and boost this year’s bloom.

p6fat-0716_o

2016 HABs Forecast

NOAA GLERL and partners will be keeping an eye on Lake Erie all summer, and in September, we’ll be sending our Environmental Sample Processor (ESPniagara) on its first mission to monitor algal toxins in real-time near the Toledo water intake.

For more information, check out our new and improved HABs and Hypoxia homepage.

June 30, 2016
by GLERL Communications Team
Comments Off on GLANSIS featured in IJC newsletter

GLANSIS featured in IJC newsletter

Last week, the International Joint Commission featured an article on GLANSIS in their monthly newsletter.

Here’s a snippet:

glansis-poster-great-lakes-connection.jpg

A poster showing images of aquatic nonindigenous species established in the Great Lakes. Credit: NOAA

June 23, 2016
by GLERL Communications Team
Comments Off on The Quarterly Climate Impacts and Outlook for the Great Lakes Region is out!

The Quarterly Climate Impacts and Outlook for the Great Lakes Region is out!

Happy Summer!

The Great Lakes Region Quarterly Climate Impacts and Outlook June 2016 was published today.

As you may have noticed, this spring was fairly mild temperature-wise and mostly uneventful in terms of severe weather. After a couple of late cold spells and above-average precipitation in early spring, May brought a few record-breaking temperatures within the region and lower than average rainfall. .

Despite the late-season dry conditions, lake levels are at or above average throughout the entire region as we enter summer and warmer than average temperatures are predicted from July through September.

To read more on the past season’s outcomes, as well as the forecast for summer, download the complete report below.

Download PDF


About the Quarterly Climate Outlook:

NOAA and its partners around the Great Lakes region work together to produce the Quarterly Climate Index and Outlook to inform the public about recent climate impacts within their respective regions. This regional climate outlook discusses the major climate events during the past three months and contains historical seasonal assessments as well as future climate outlooks.

To receive this outlook via email, visit: https://illinois.edu/gm/subscribe/17196.