NOAA - Great Lakes Environmental Research Laboratory

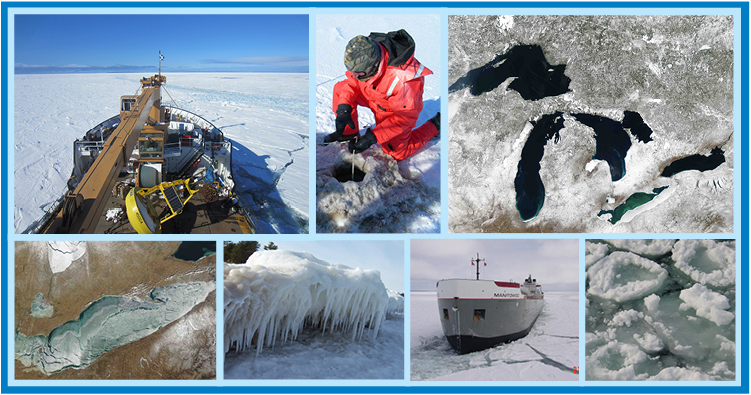
Understanding the major effect of ice on the Great Lakes is crucial because it impacts a range of societal benefits provided by the lakes, from hydropower generation to commercial shipping to the fishing industry. The amount of ice cover varies from year to year, as well as how long it remains on the lakes. GLERL scientists are observing long-term changes in ice cover as a result of global warming. Studying, monitoring, and predicting ice coverage on the Great Lakes plays an important role in determining climate patterns, lake water levels, water movement patterns, water temperature structure, and spring plankton blooms.
NOAA-GLERL has been exploring the relationships between ice cover, lake thermal structure, and regional climate for over 30 years through development, maintenance, and analysis of historical model simulations and observations of ice cover, surface water temperature, and other variables. Weekly ice cover imaging products produced by the Canadian Ice Service started in 1973. Beginning in 1989, the U.S. National Ice Center produced Great Lakes ice cover charts that combined both Canadian and U.S. agency satellite imagery. These products are downloaded at GLERL by our Coastwatch program, a nationwide NOAA program within which the GLERL functions as the Great Lakes regional node. In this capacity, GLERL obtains, produces, and delivers environmental data and products for near real-time observation of the Great Lakes to support environmental science, decision making, and supporting research. This is achieved by providing access to near real-time and retrospective satellite observations and in-situ Great Lakes data.
CoastWatch is a nationwide National Oceanic and Atmospheric Administration
(NOAA) program within which the Great Lakes Environmental Research Laboratory (GLERL) functions as the Great Lakes regional node. In this capacity,
GLERL obtains, produces, and delivers environmental data and products for near real-time observation of the Great Lakes to support environmental science,
decision making, and supporting research. This is achieved by providing access to near real-time and retrospective satellite observations and in-situ Great Lakes data.
GLSEA (The Great Lakes Surface Environmental Analysis) is a digital map of the Great Lakes surface water temperature and ice cover which is produced daily at GLERL.
The lake surface temperatures are derived from NOAA polar-orbiting satellite imagery.
The addition of ice cover information was implemented in early 1999, using data provided by the US National Ice Center (USNIC). Lake surface temperatures are updated daily with information from the cloud-free portions of the previous day's satellite imagery. If no imagery is available,
a smoothing algorithm is applied to the previous day's map.
|
Superior % |
Michigan % |
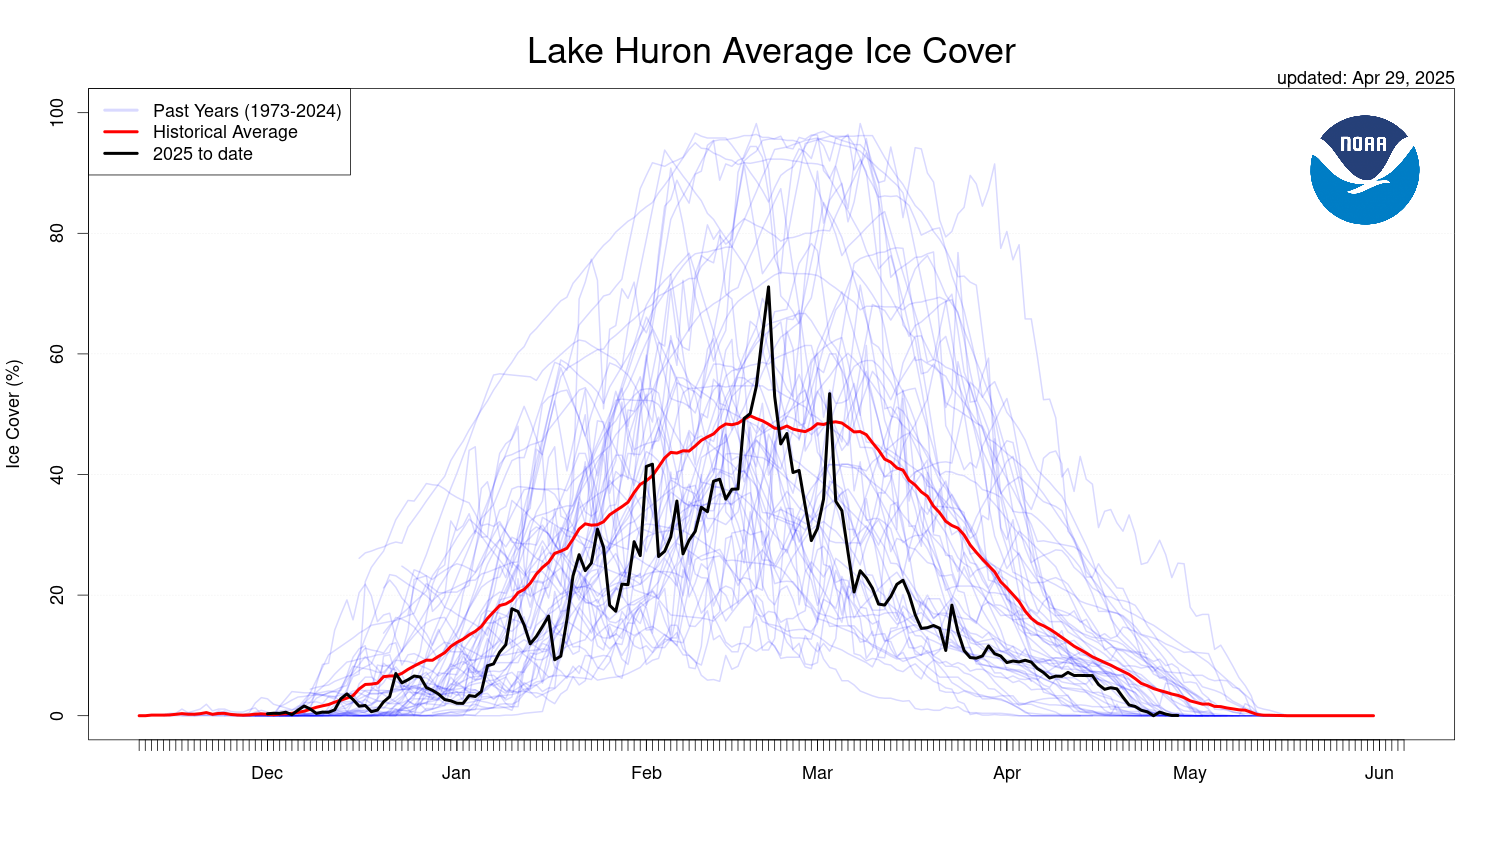
Huron % |
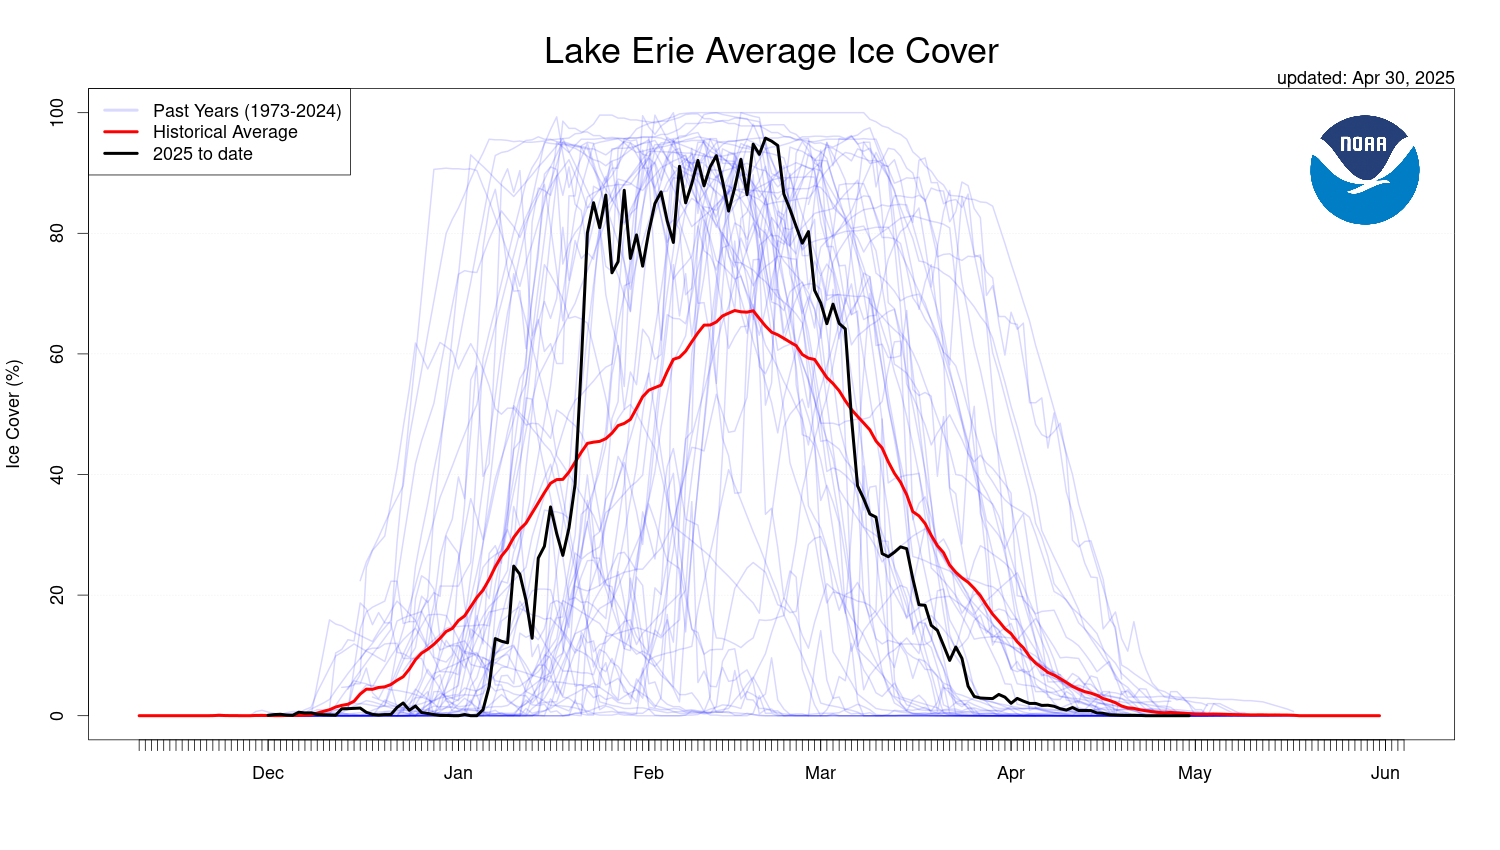
Erie % |
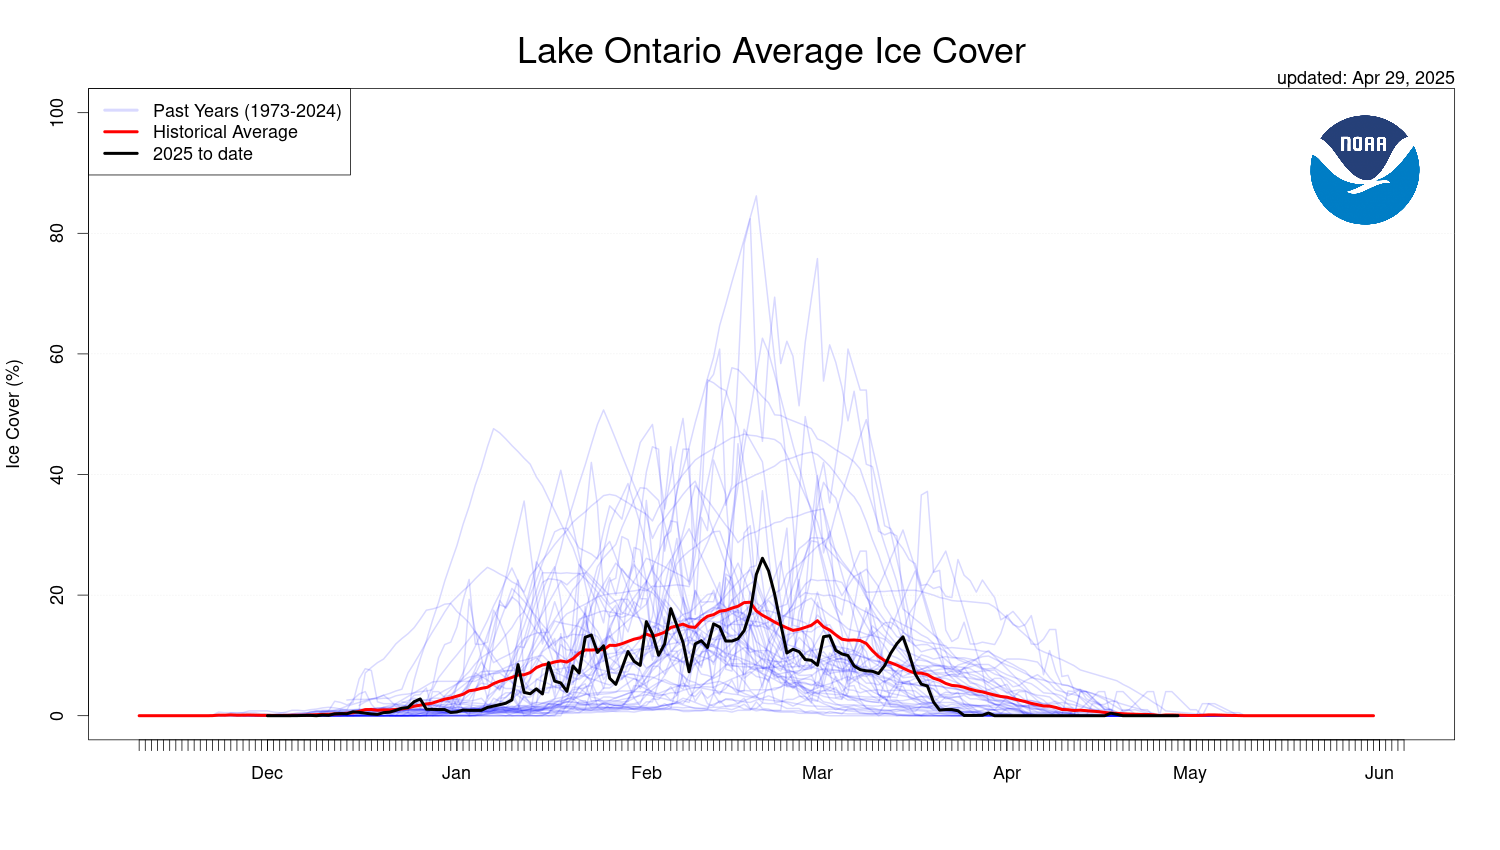
Ontario % |
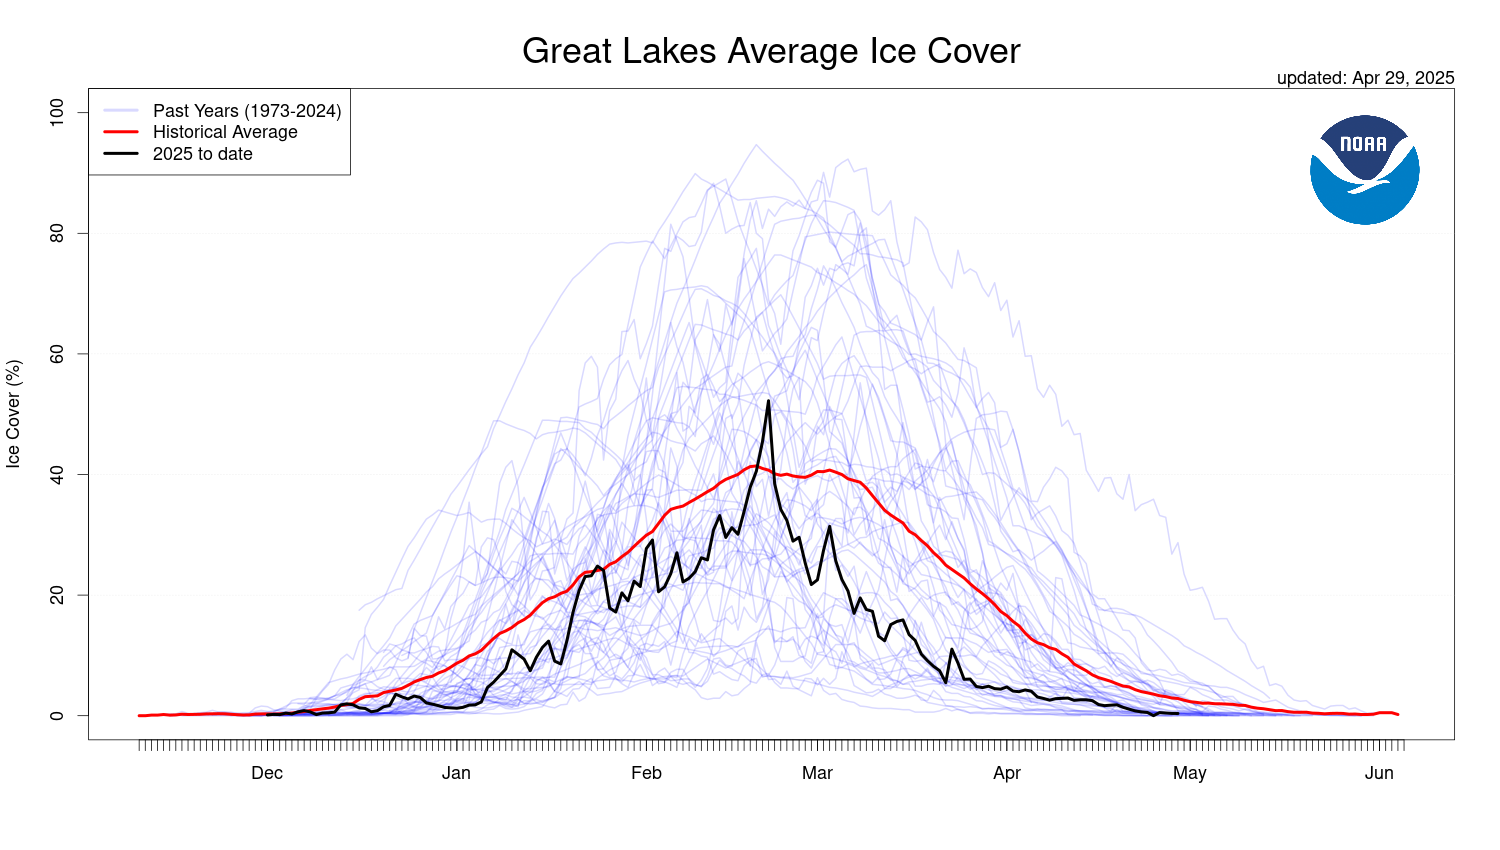
Great Lakes % |
 |
 |
 |
 |
 |
 |
NOAA/GLERL has been monitoring and documenting Great Lakes ice cover since the early 1970's using the ice products developed by the U.S. National Ice Center and the Canadian Ice Service. Research conducted on hydrometeorological processes and regional climate trends has led to models of lake thermal structure that play an integral role in ecosystem forecasting.
Click image to enlarge:
 |
 |
 |
 |
 |
 |
Data files:
This database simplifies access to Great Lakes ice cover data by bringing the basic units of data together for the entire time period, 1973-present. The (now retired) Great Lakes Ice Atlas summarized ice cover for the period 1973-2002, with addendums in a separate report for 2003-2005, in addition to providing a number of statistical products. Using the same methods, the original ice charts for 2006 through present were processed and added to this database. In 2020, the entire dataset (1973 - present) was standardized to the newer, high resolution grid and is described in Yang et al. 2020.
About the raw data:
Original ice charts are provided in three forms: asci grid files, jpeg image files, and ArcGIS shapefiles. From 1973 through 1988, the source was
the Canadian Ice Service. Beginning with 1989, the source was the
U.S. National Ice Center, (NIC). Data from both Canadian and U.S.
sources is combined in NIC's daily products.
Files that align ascii grid data with location
and lake are here: geographic metadata
| 1973 - 1979 | 1980 - 1989 | 1990 - 1999 | 2000 - 2009 | 2010 - 2019 | 2020 - 2023 |
|
grid files shapefiles jpg files |
grid files shapefiles jpg files |
grid files shapefiles jpg files |
grid files shapefiles jpg files |
grid files shapefiles jpg files |
grid files shapefiles jpg files |
| 1973 Max ice cover: 2/27/1973 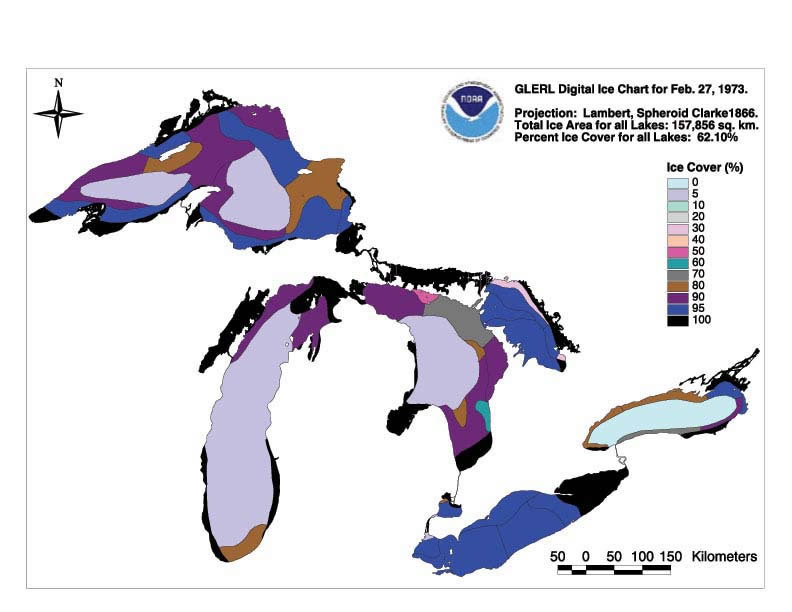 1973 summary |
1974 Max ice cover: 2/21/1974 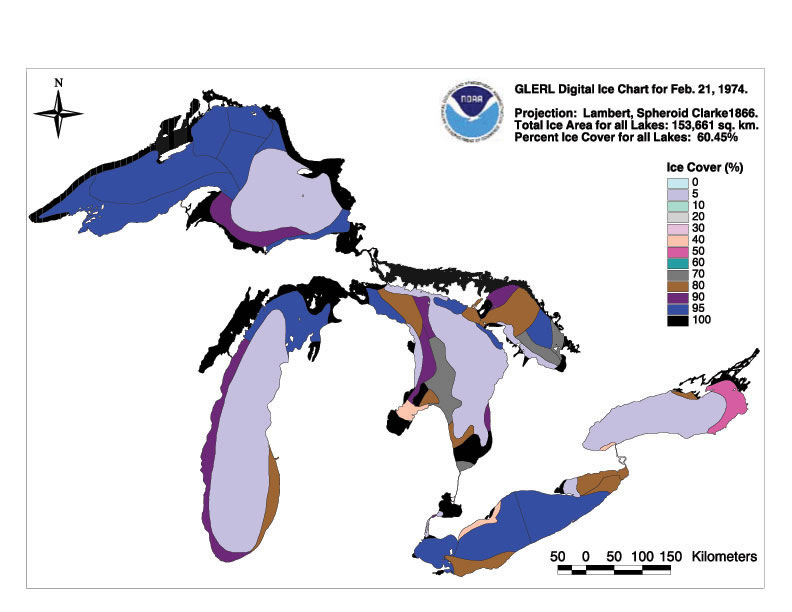 1974 summary |
1975 Max ice cover: 2/13/1975 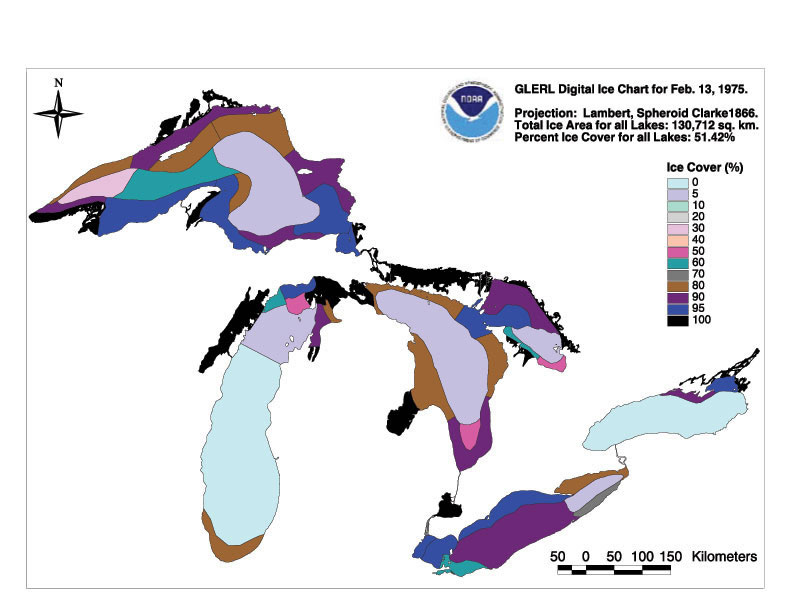 1975 summary |
1976 Max ice cover: 2/3/1976 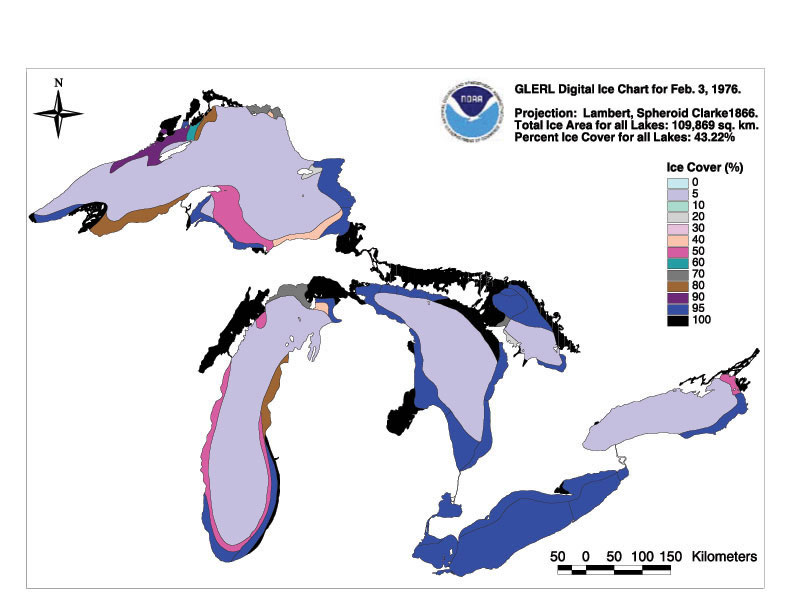 1976 summary |
1977 Max ice cover: 2/9/1977 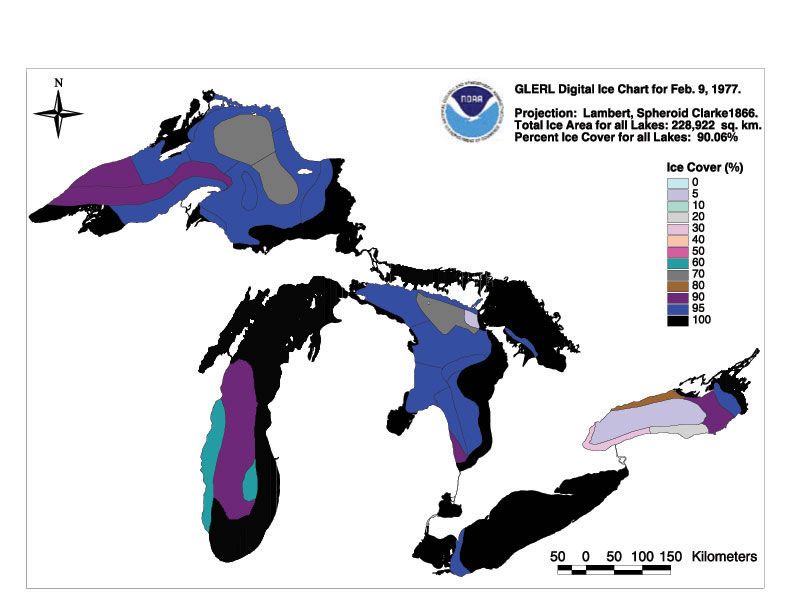 1977 summary |
| 1978 Max ice cover: 3/1/1978 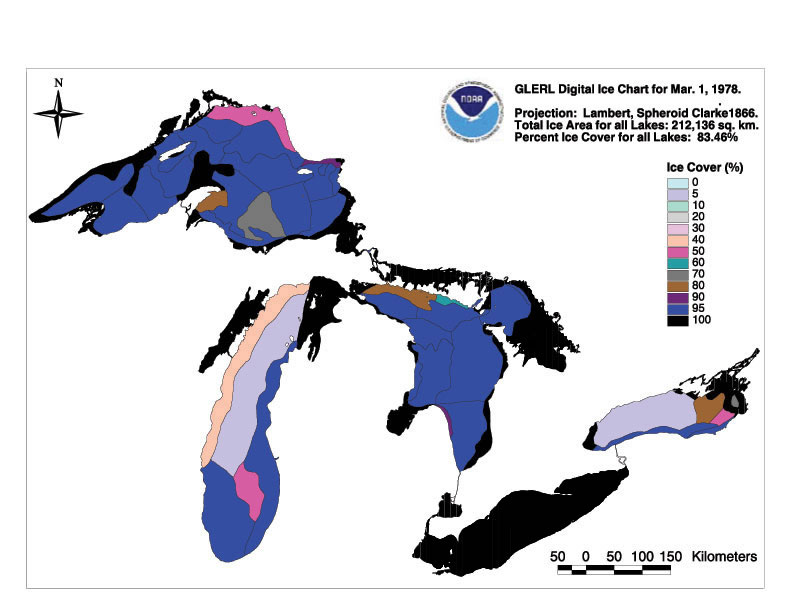 1978 summary |
1979 Max ice cover: 2/19/1979 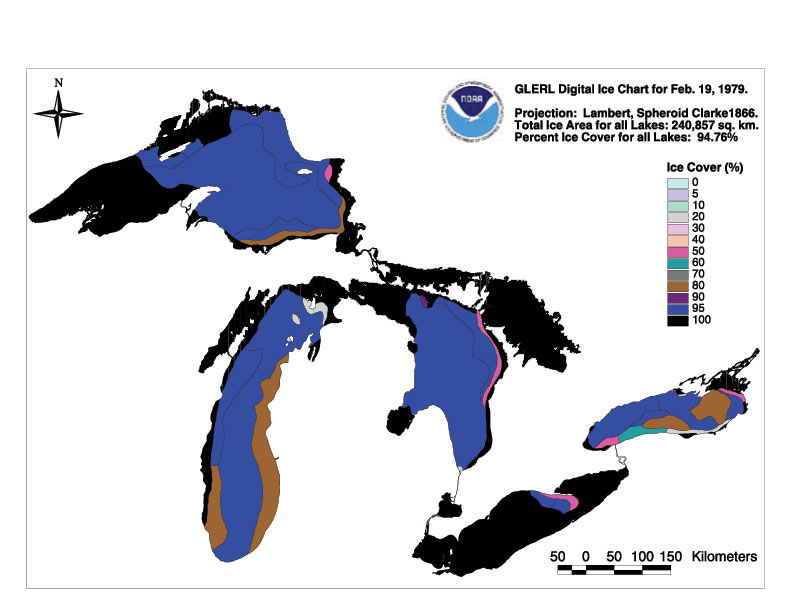 1979 summary |
1980 Max ice cover: 3/5/1980 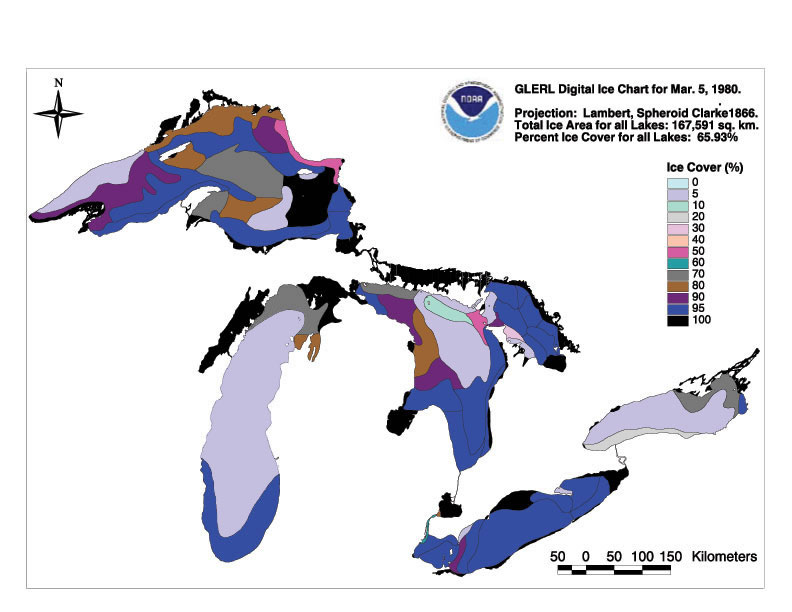 1980 summary |
1981 Max ice cover: 2/11/1981 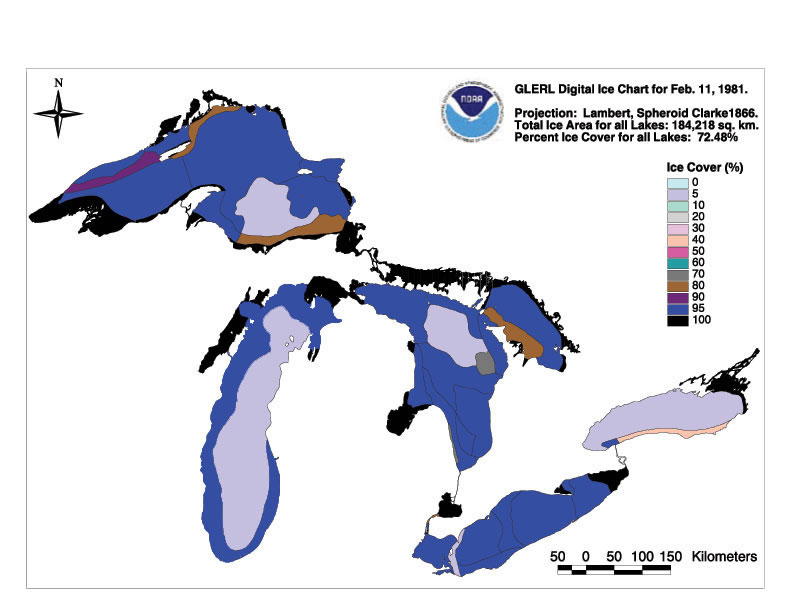 1981 summary |
1982 Max ice cover: 3/9/1982 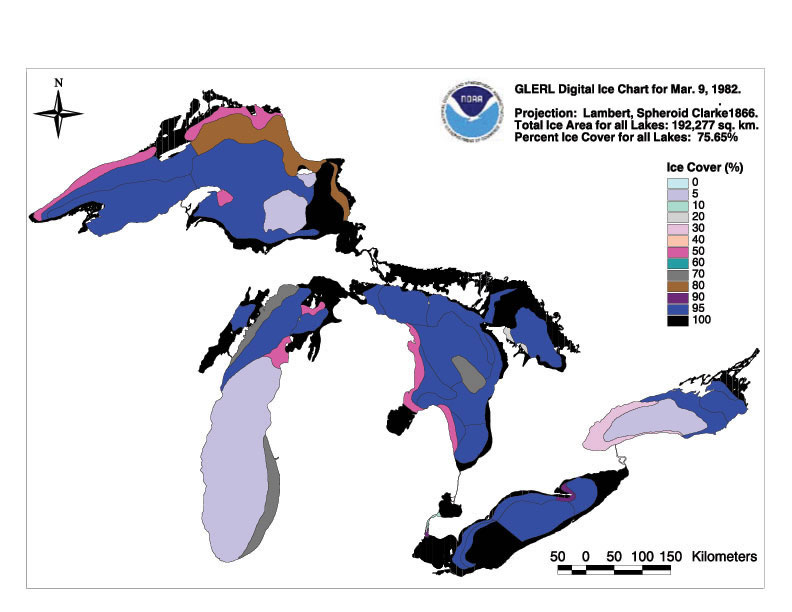 1982 summary |
| 1983 Max ice cover: 2/14/1983 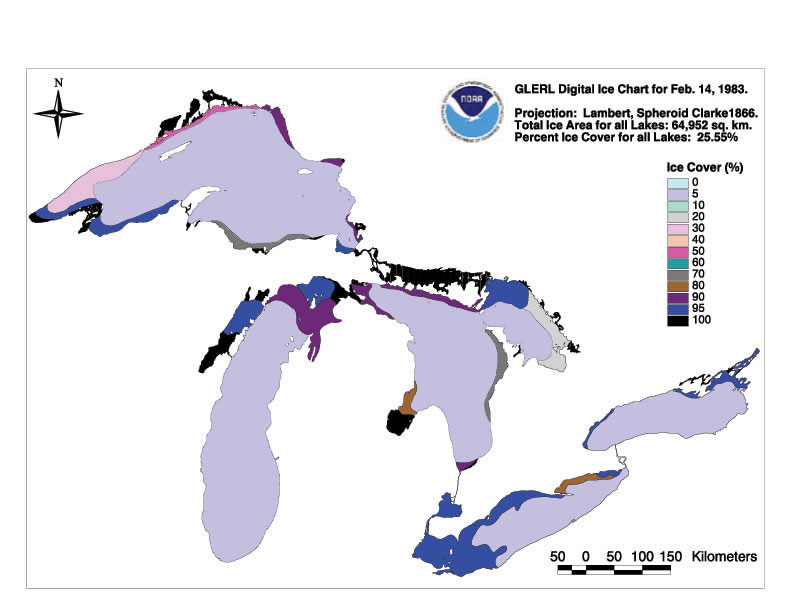 1983 summary |
1984 Max ice cover: 3/15/1984 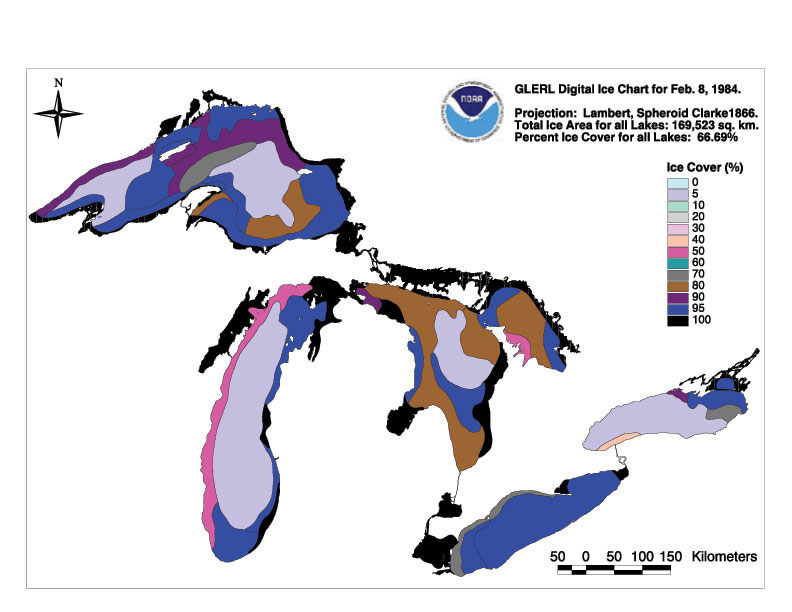 1984 summary |
1985 Max ice cover: 2/23/1985 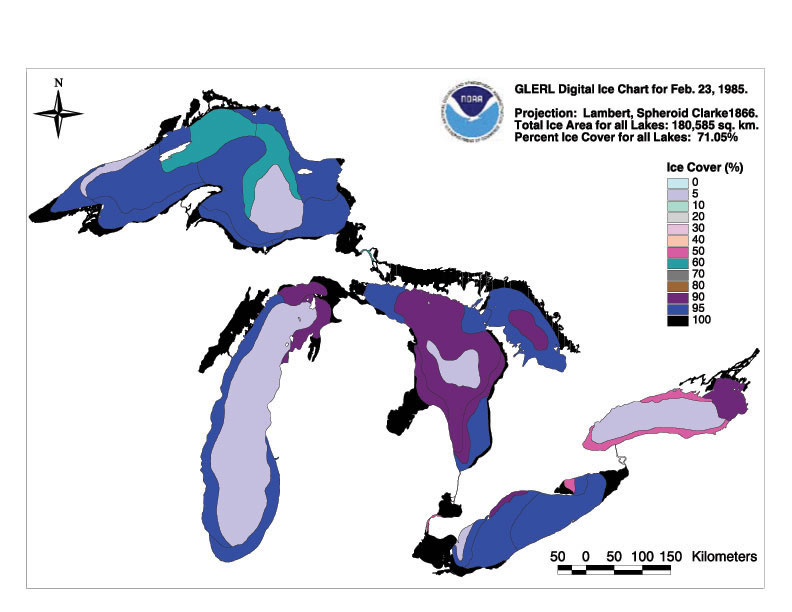 1985 summary |
1986 Max ice cover: 2/22/1986 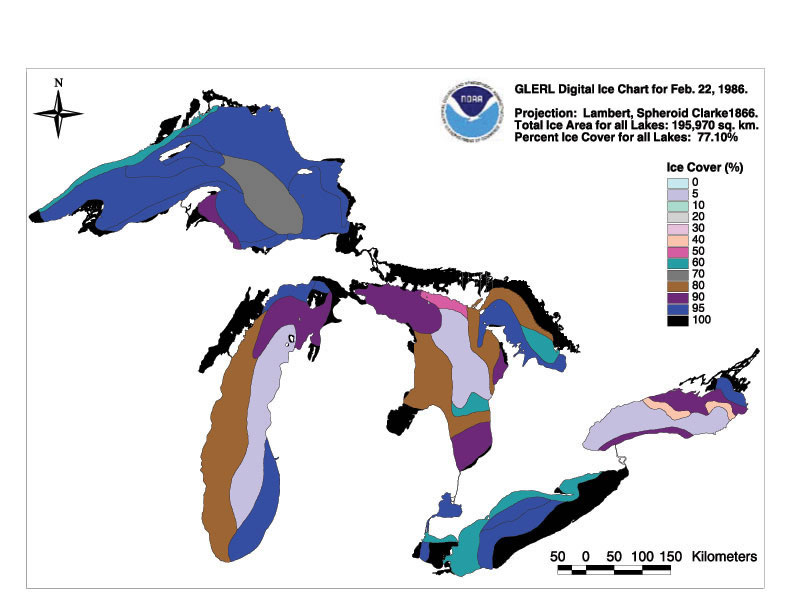 1986 summary |
1987 Max ice cover: 2/14/1987 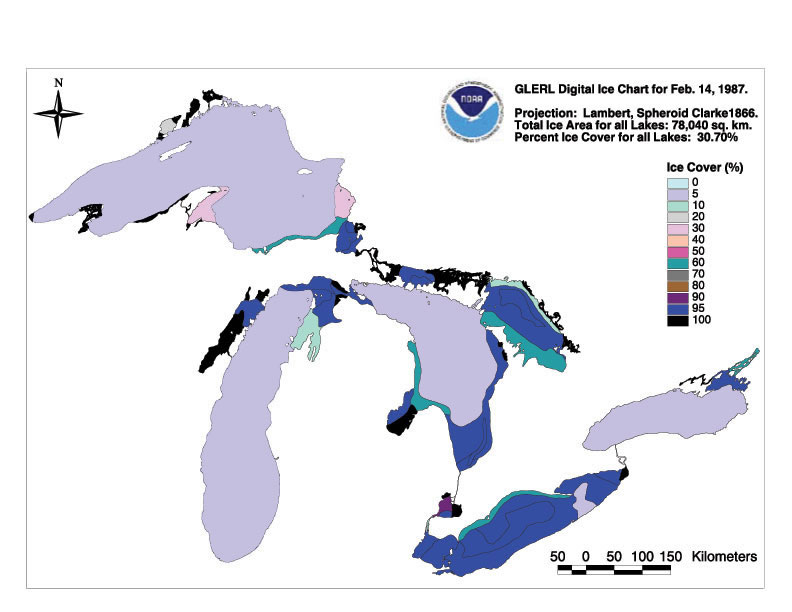 1987 summary |
| 1988 Max ice cover: 2/21/1988 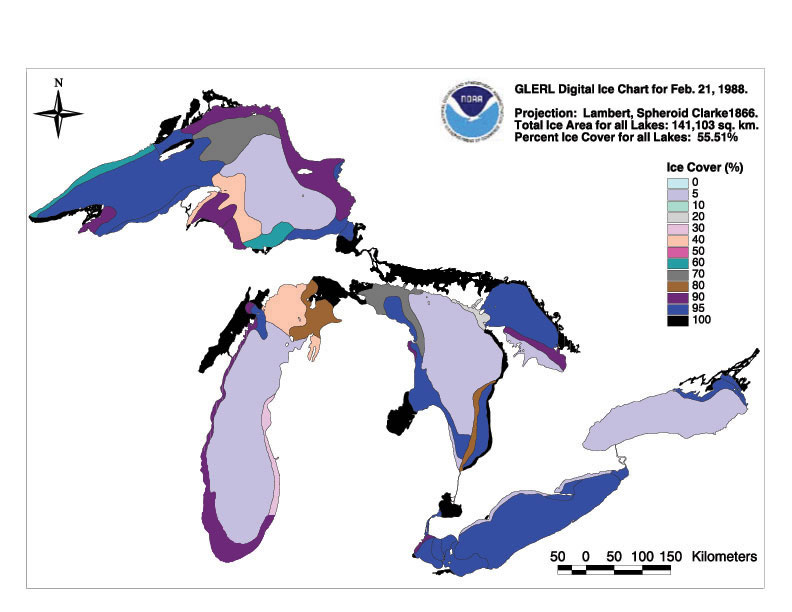 1988 summary |
1989 Max ice cover: 3/8/1989 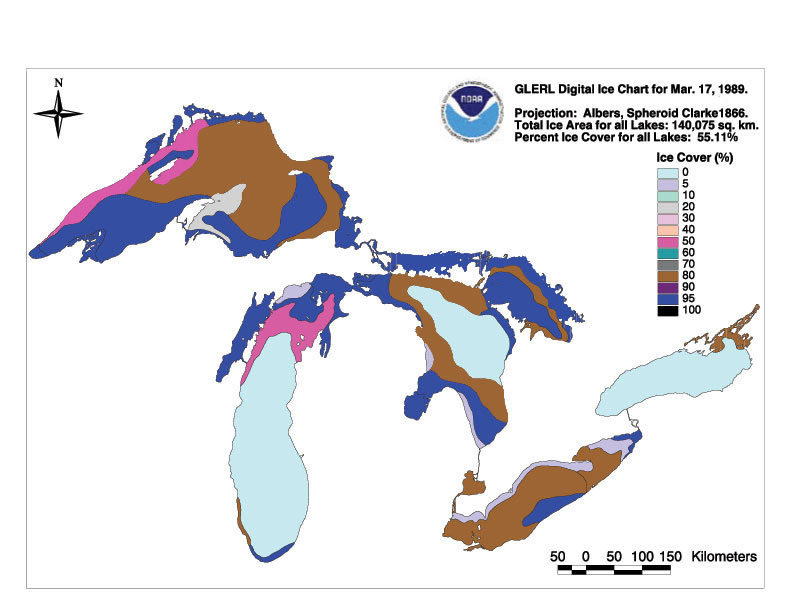 1989 summary |
1990 Max ice cover: 3/7/1990 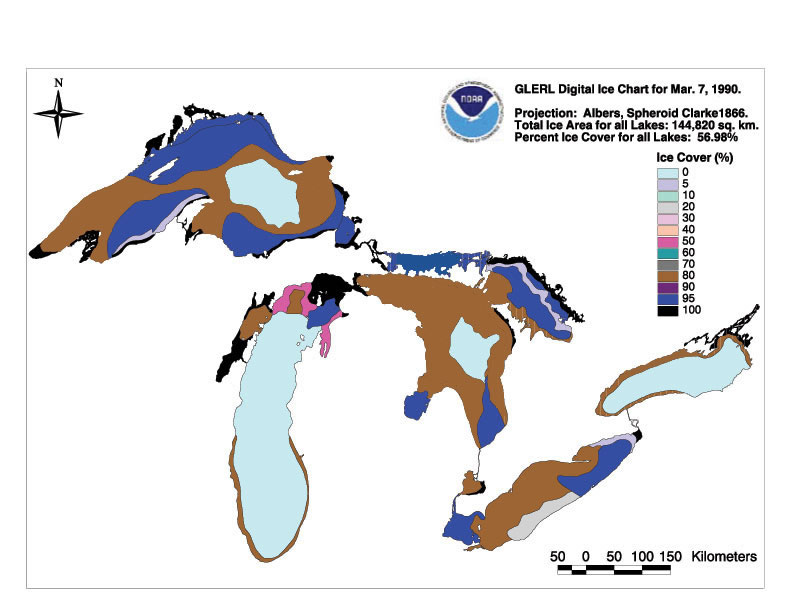 1990 summary |
1991 Max ice cover: 2/27/1991 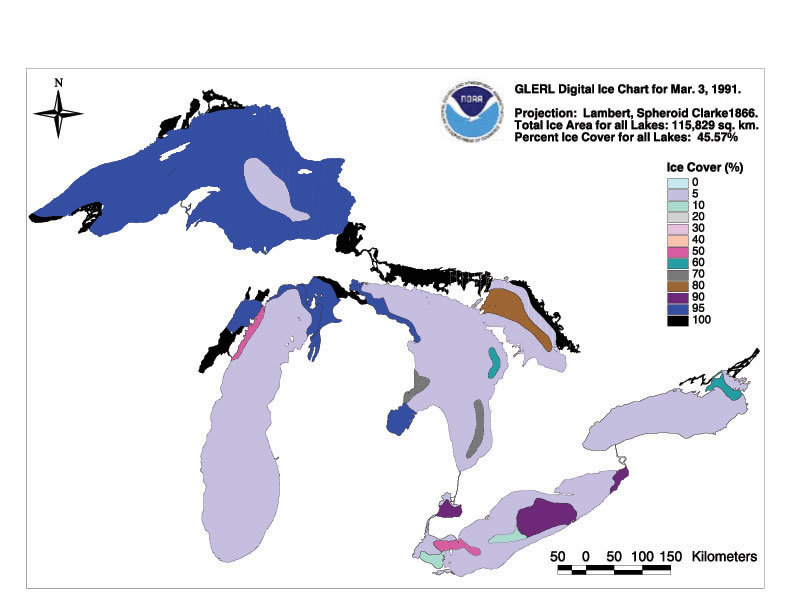 1991 summary |
1992 Max ice cover: 2/23/1992 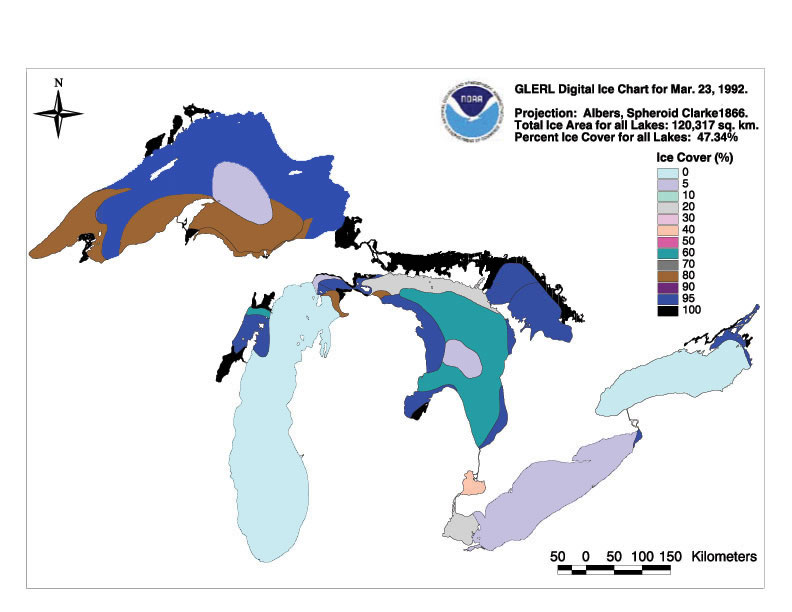 1992 summary |
| 1993 Max ice cover: 3/1/1993 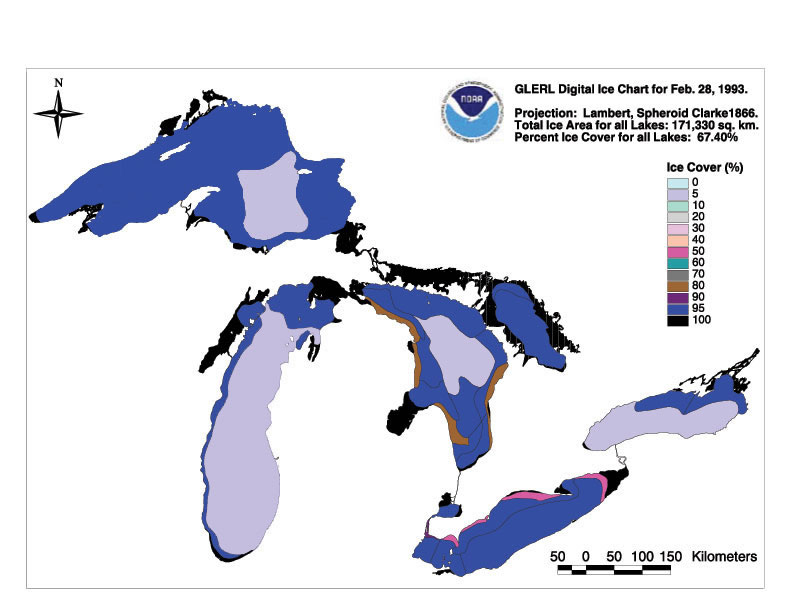 1993 summary |
1994 Max ice cover: 2/14/1994 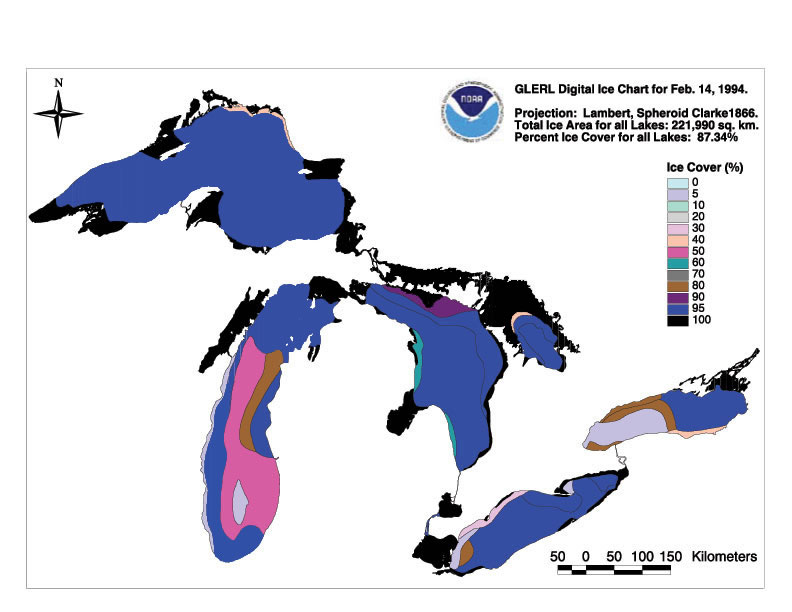 1994 summary |
1995 Max ice cover: 3/10/1995 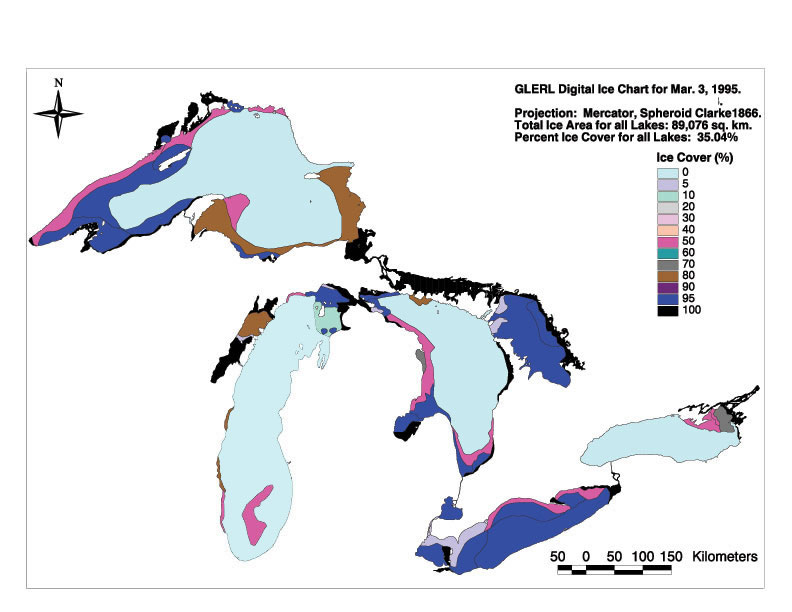 1995 summary |
1996 Max ice cover: 3/8/1996 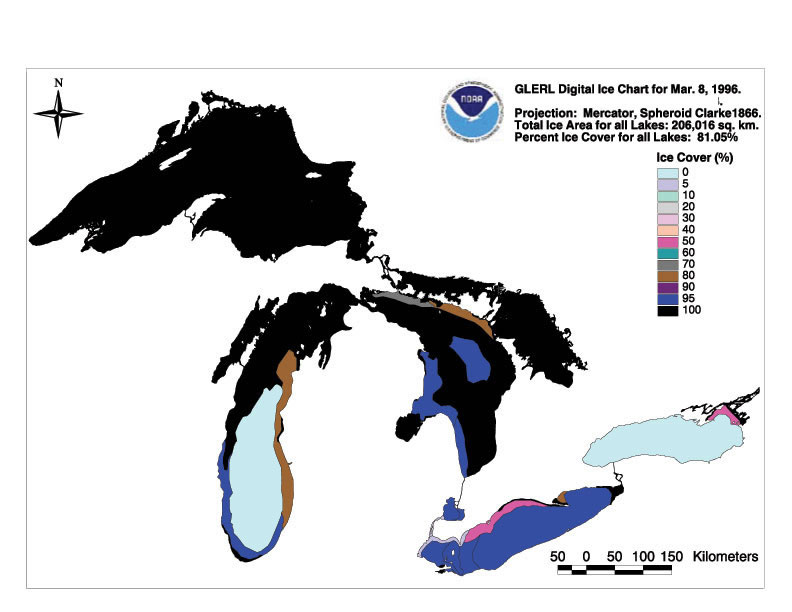 1996 summary |
1997 Max ice cover: 2/18/1997 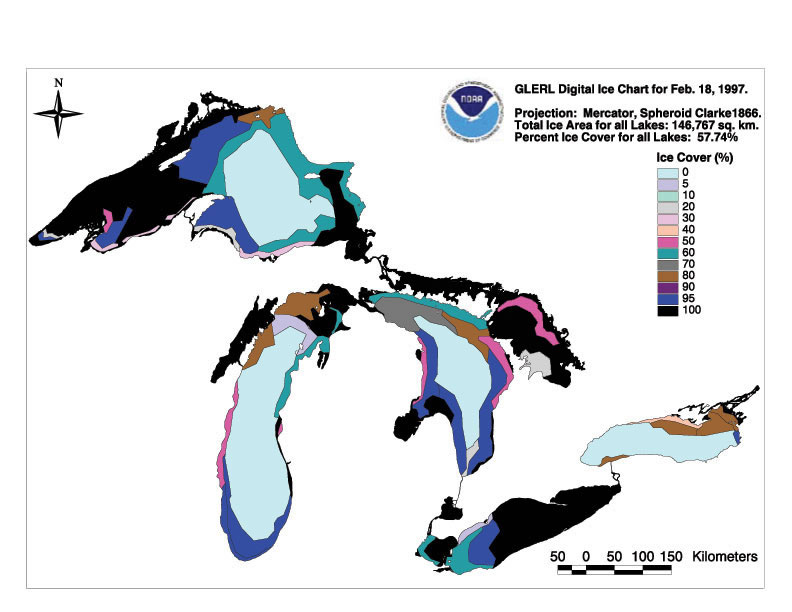 1997 summary |
| 1998 Max ice cover: 2/6/1998 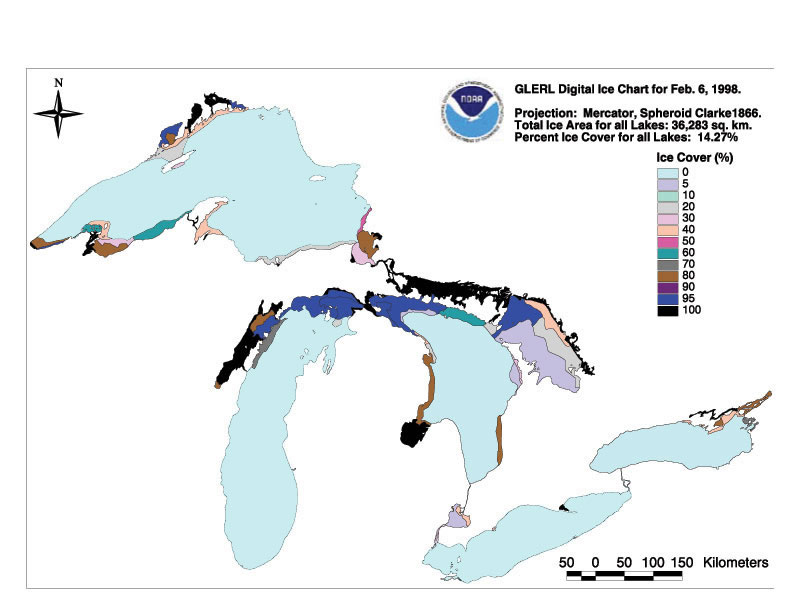 1998 summary |
1999 Max ice cover: 1/15/1999 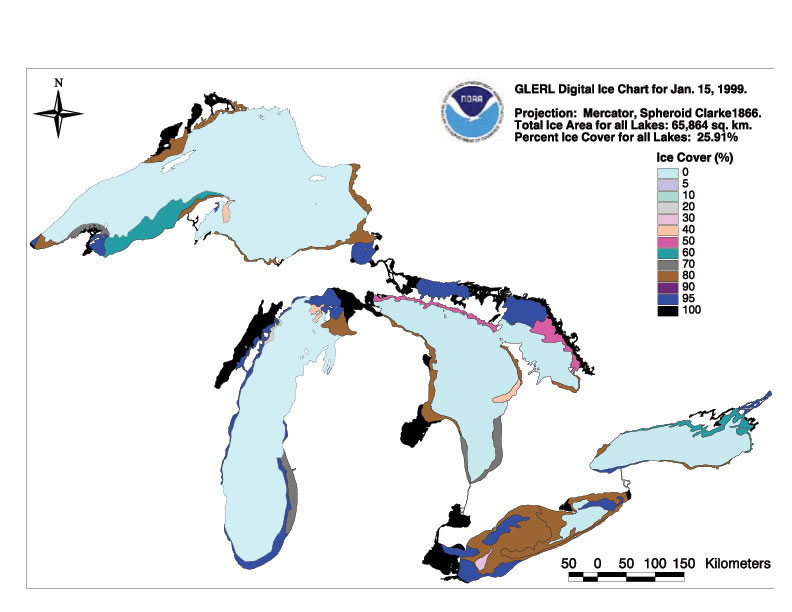 1999 summary |
2000 Max ice cover: 2/18/2000 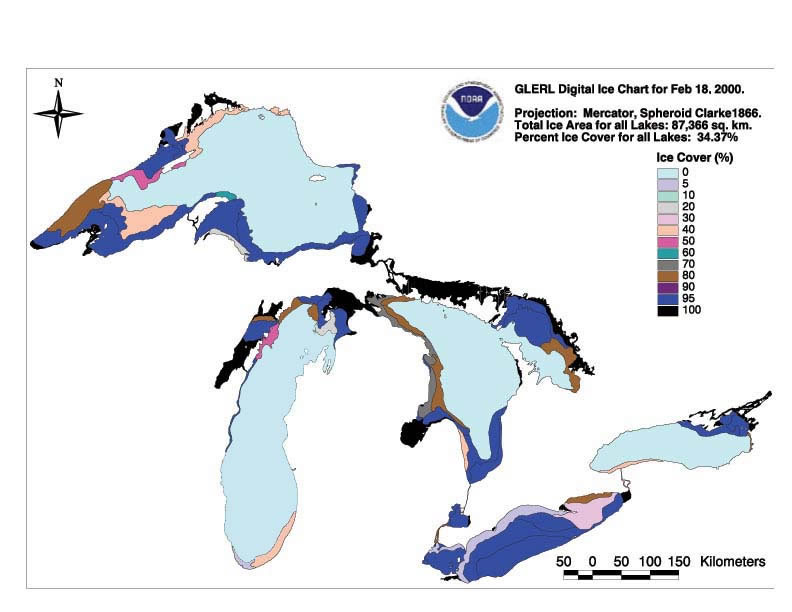 2000 summary |
2001 Max ice cover: 3/8/2001 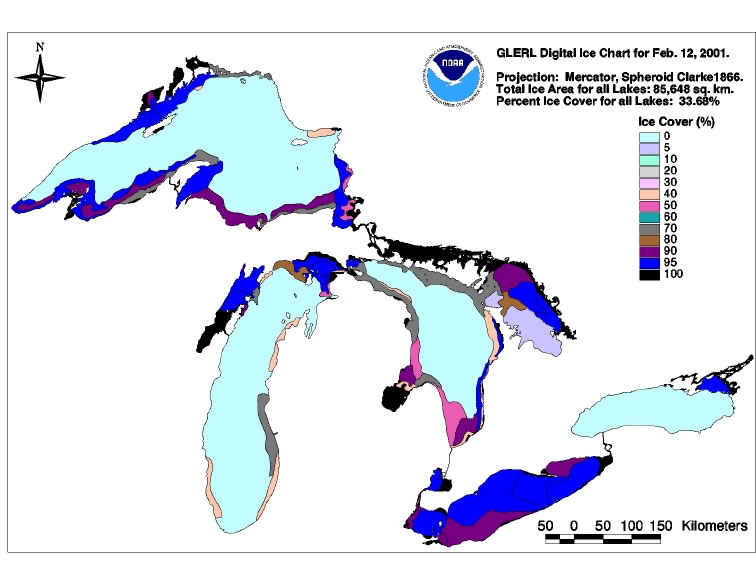 2001 summary |
2002 Max ice cover: 3/7/2002 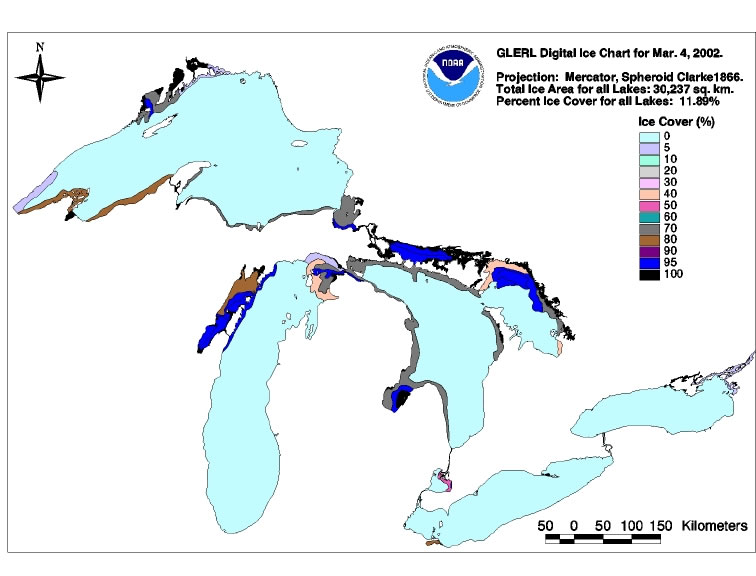 2002 summary |
| 2003 Max ice cover: 3/3/2003 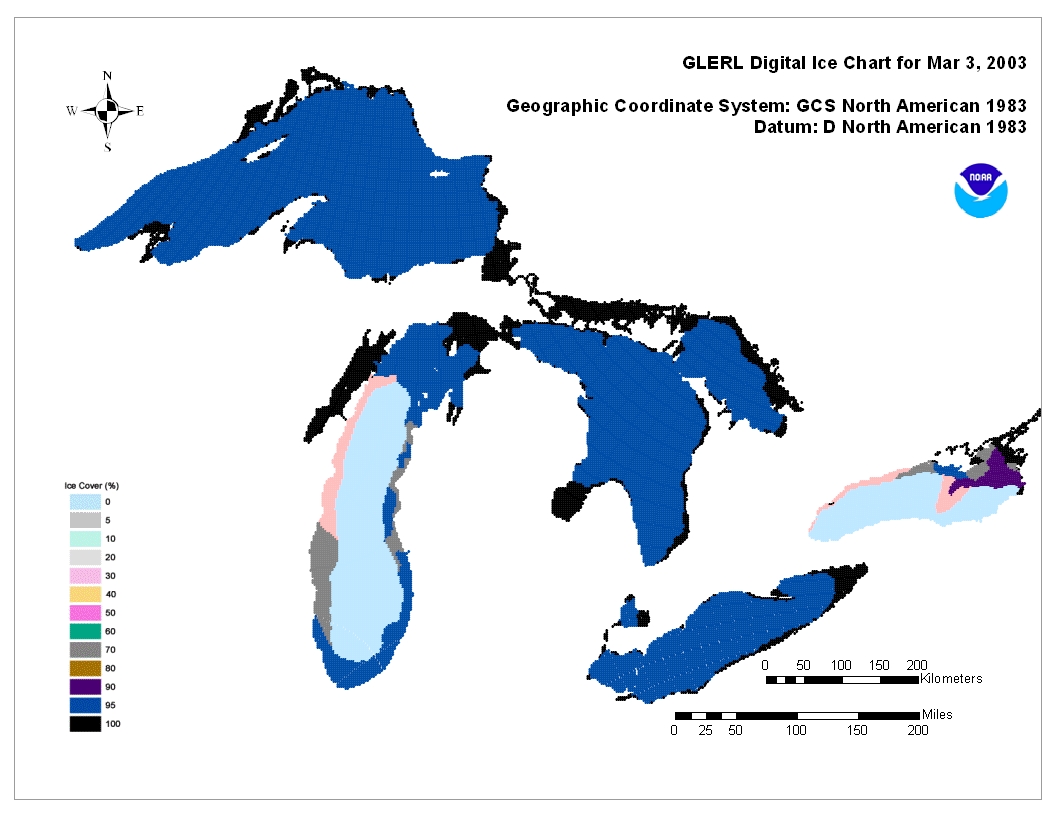 2003 summary |
2004 Max ice cover: 2/19/2004 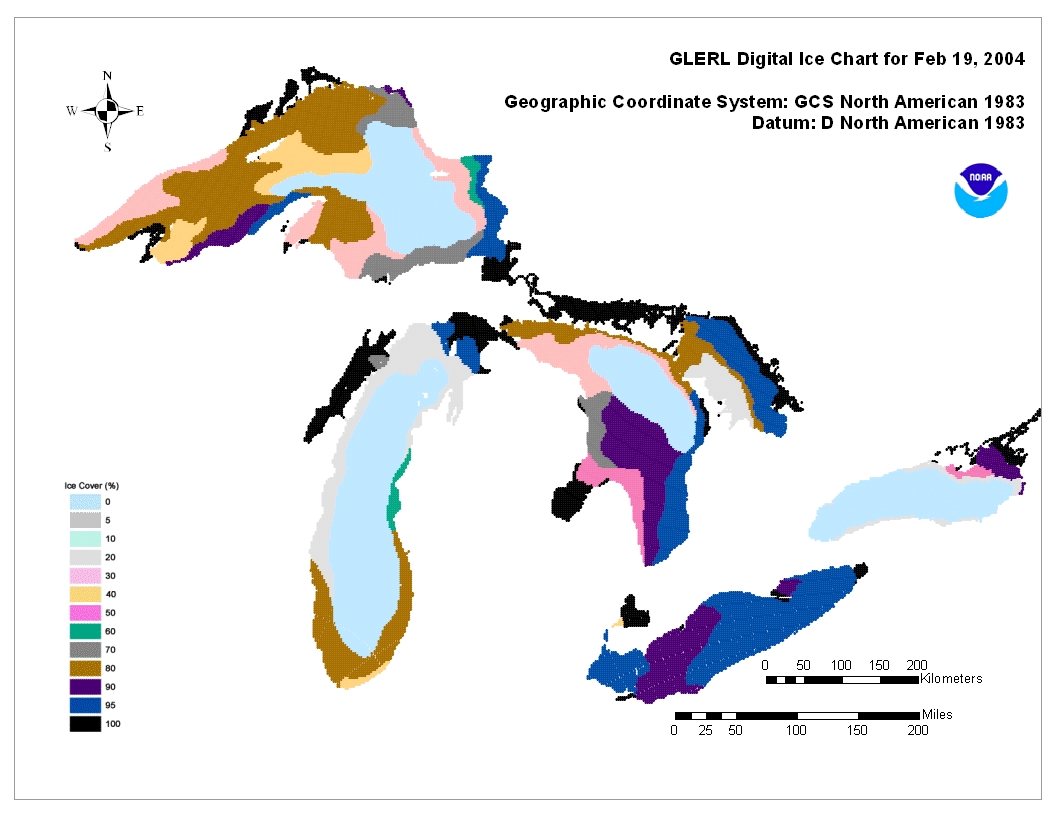 2004 summary |
2005 Max ice cover: 3/17/2005 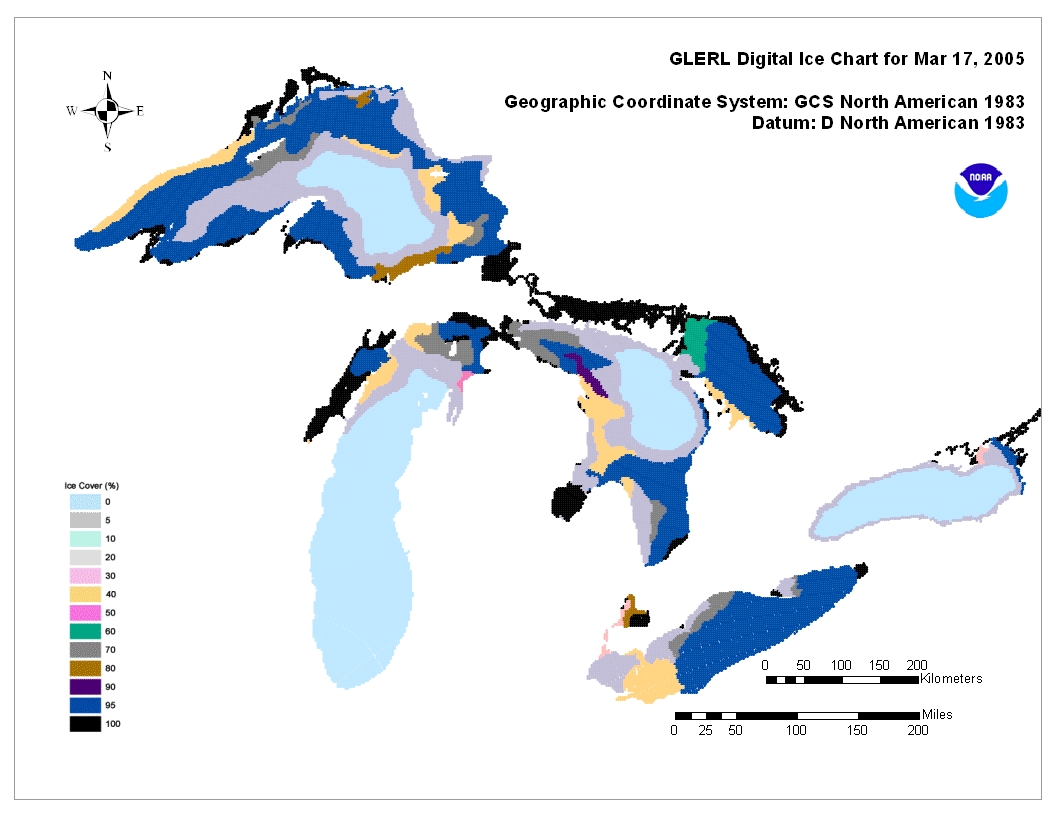 2005 summary |
2006 Max ice cover: 3/2/2006 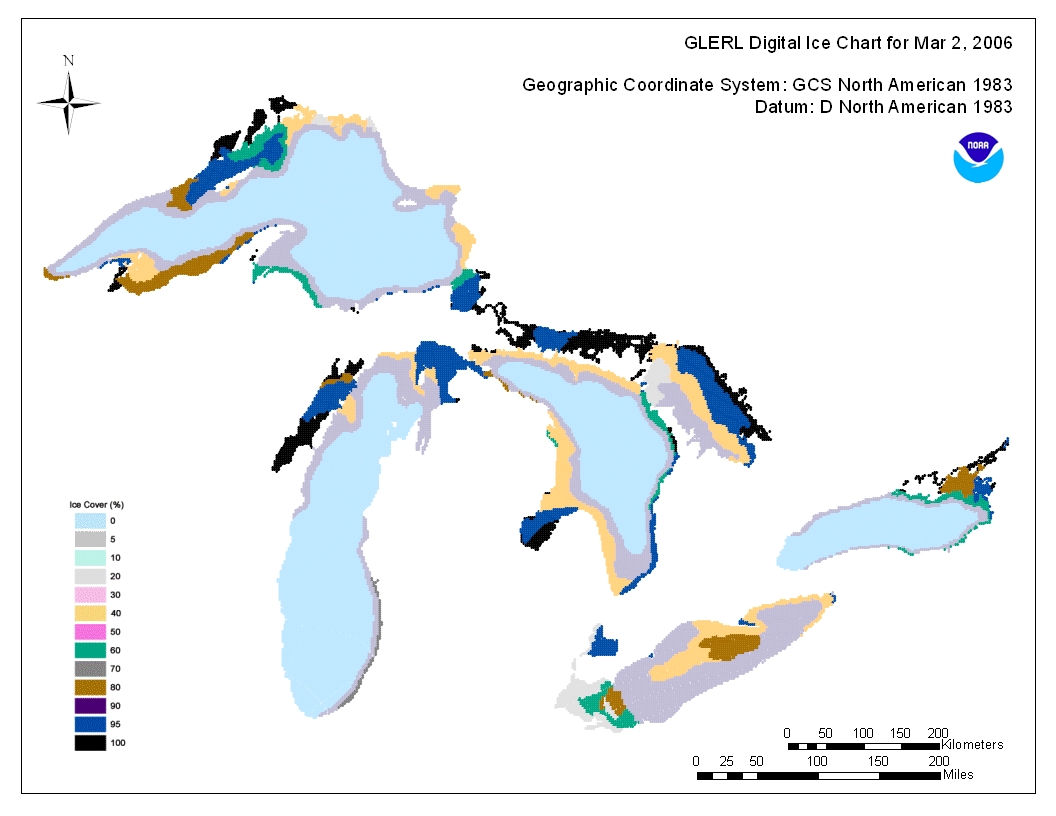 2006 summary |
2007 Max ice cover: 3/8/2007 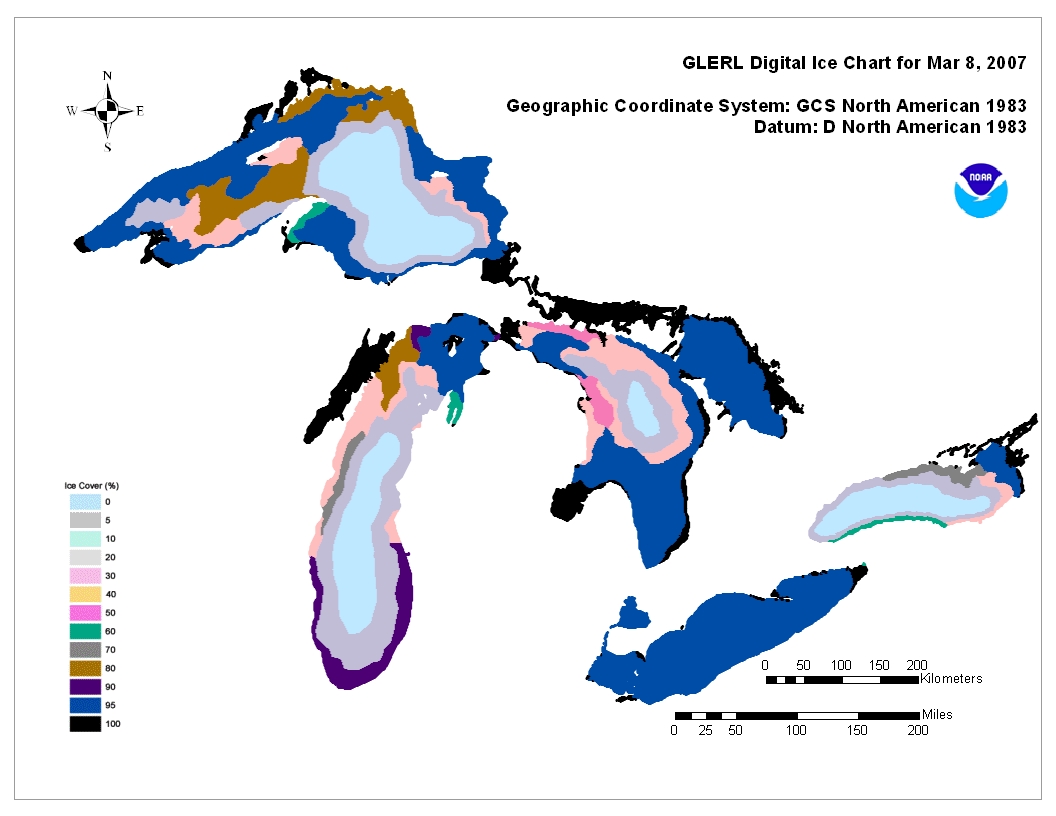 2007 summary |
| 2008 Max ice cover: 3/10/2008 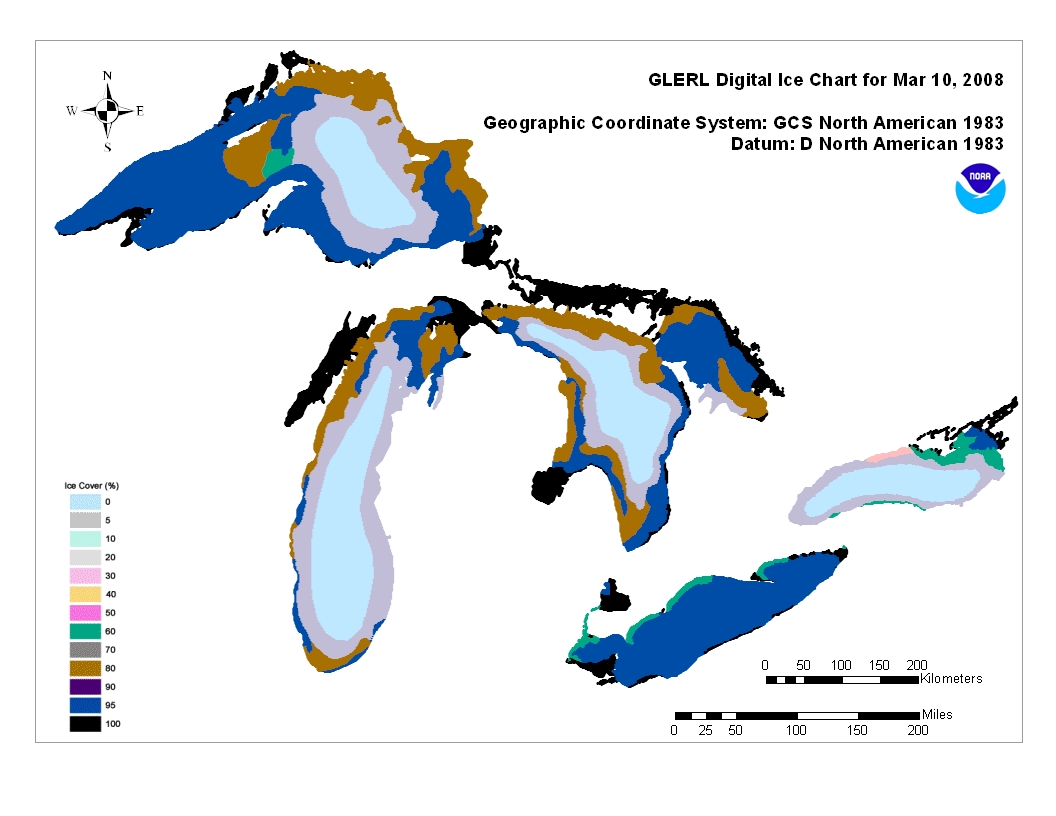 2008 summary |
2009 Max ice cover: 3/2/2009 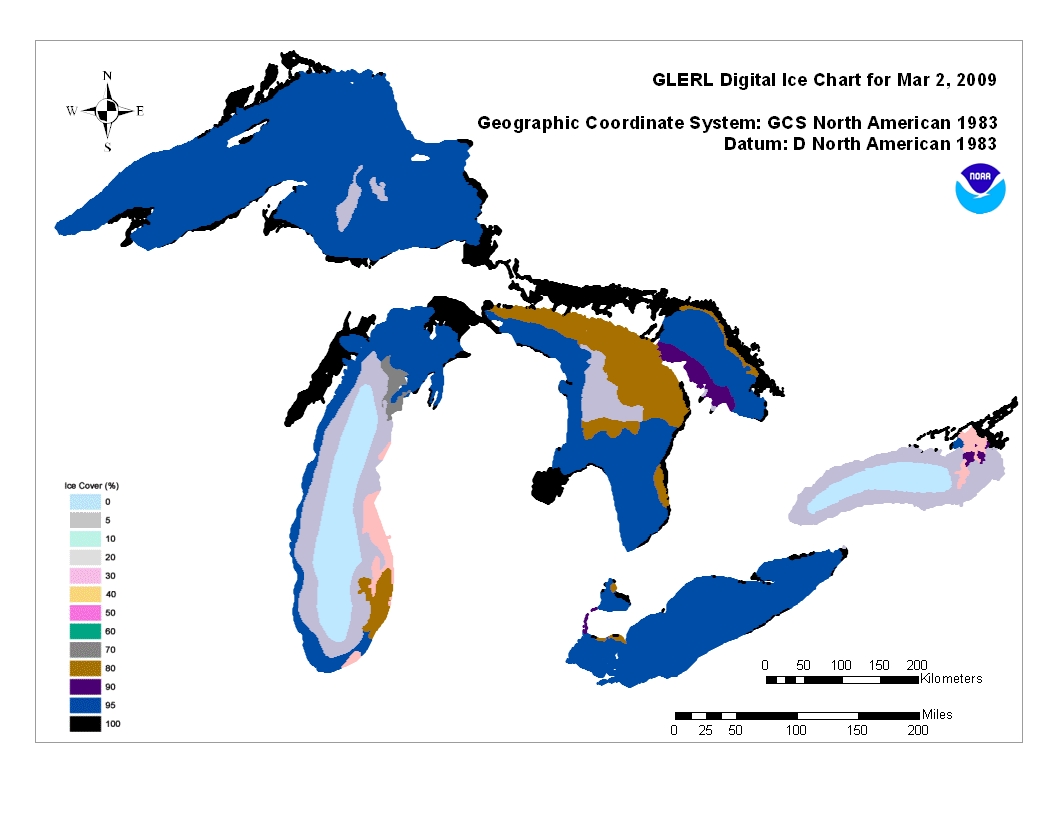 2009 summary |
2010 Max ice cover: 2/8/2010 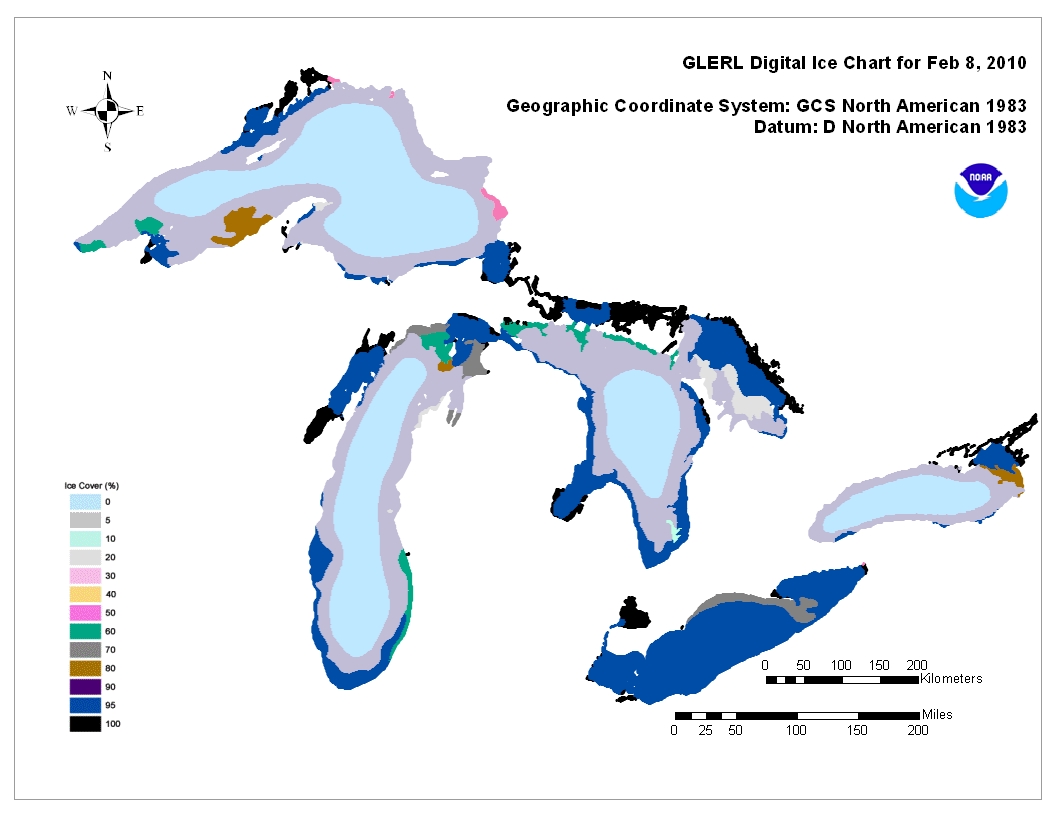 2010 summary |
2011 Max ice cover: 2/12/2011 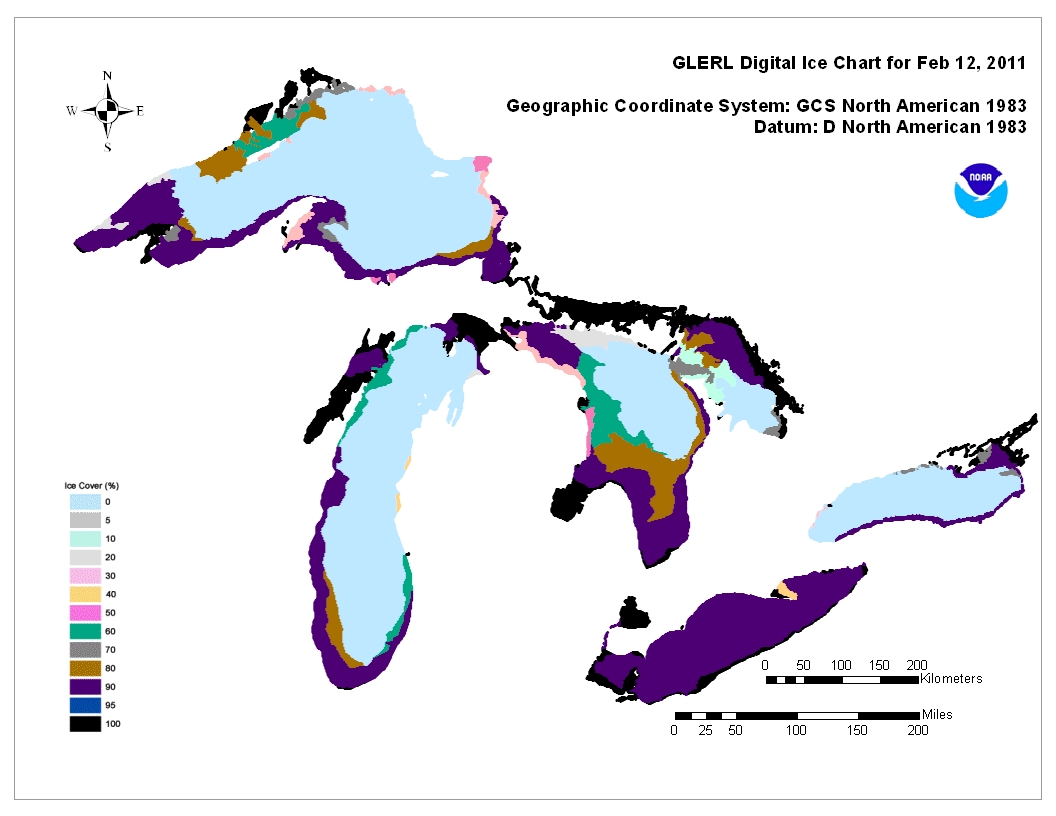 2011 summary |
2012 Max ice cover: 1/22/2012 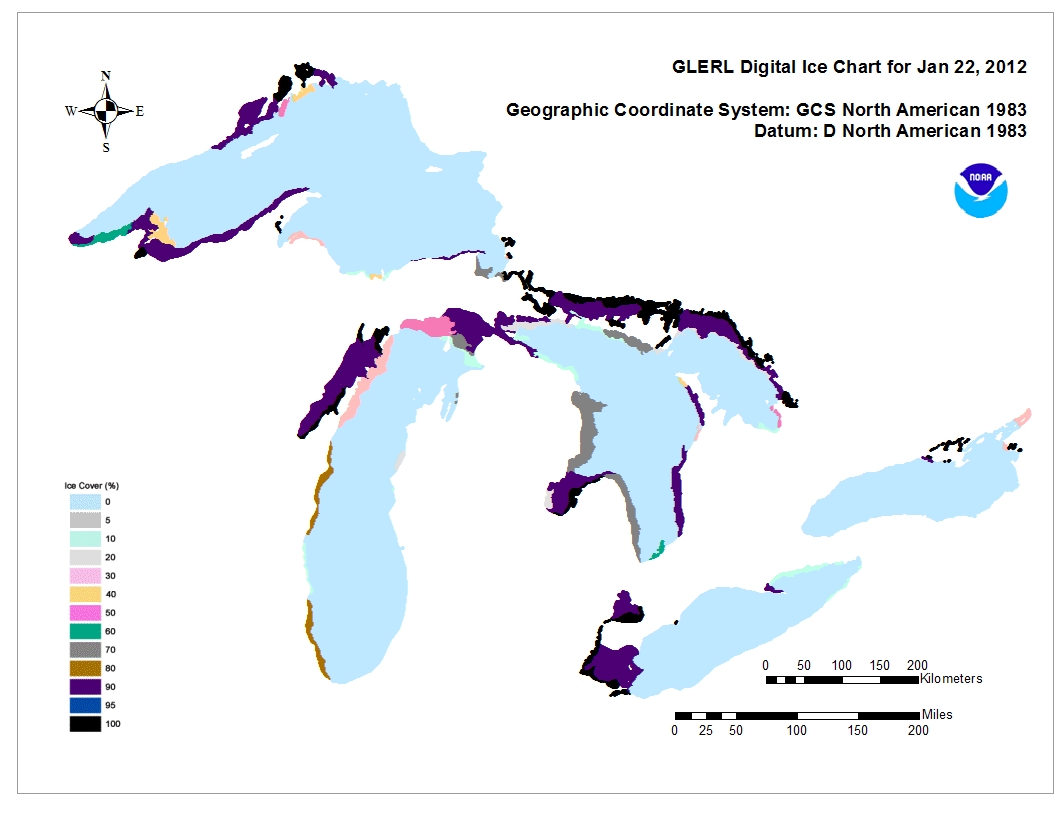 2012 summary |
| 2013 Max ice cover: 2/18/2013 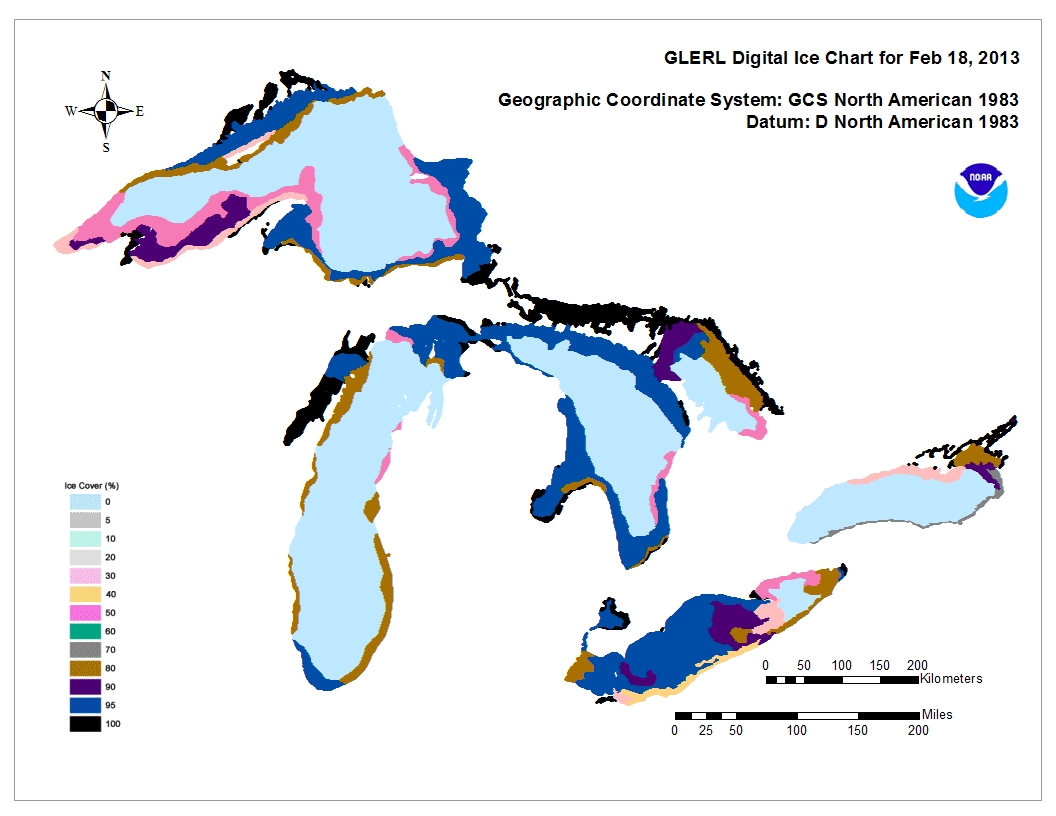 2013 summary |
2014 Max ice cover: 3/6/2014 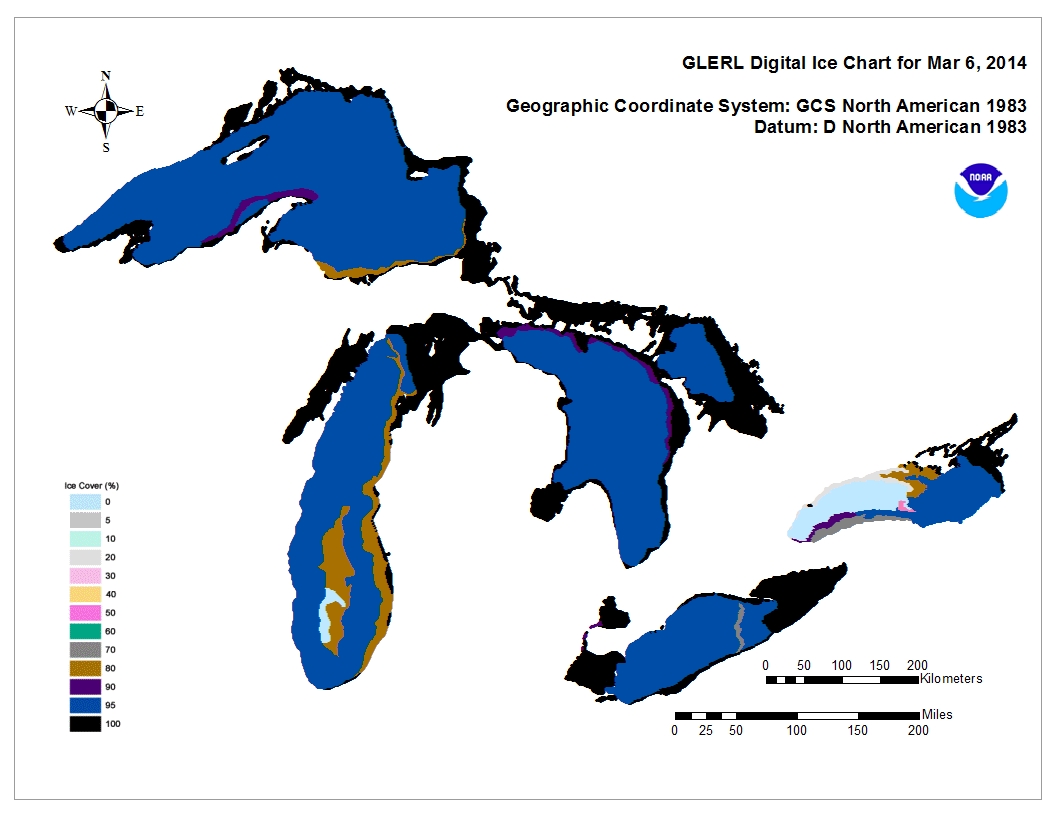 2014 summary |
2015 Max ice cover: 2/28/2015 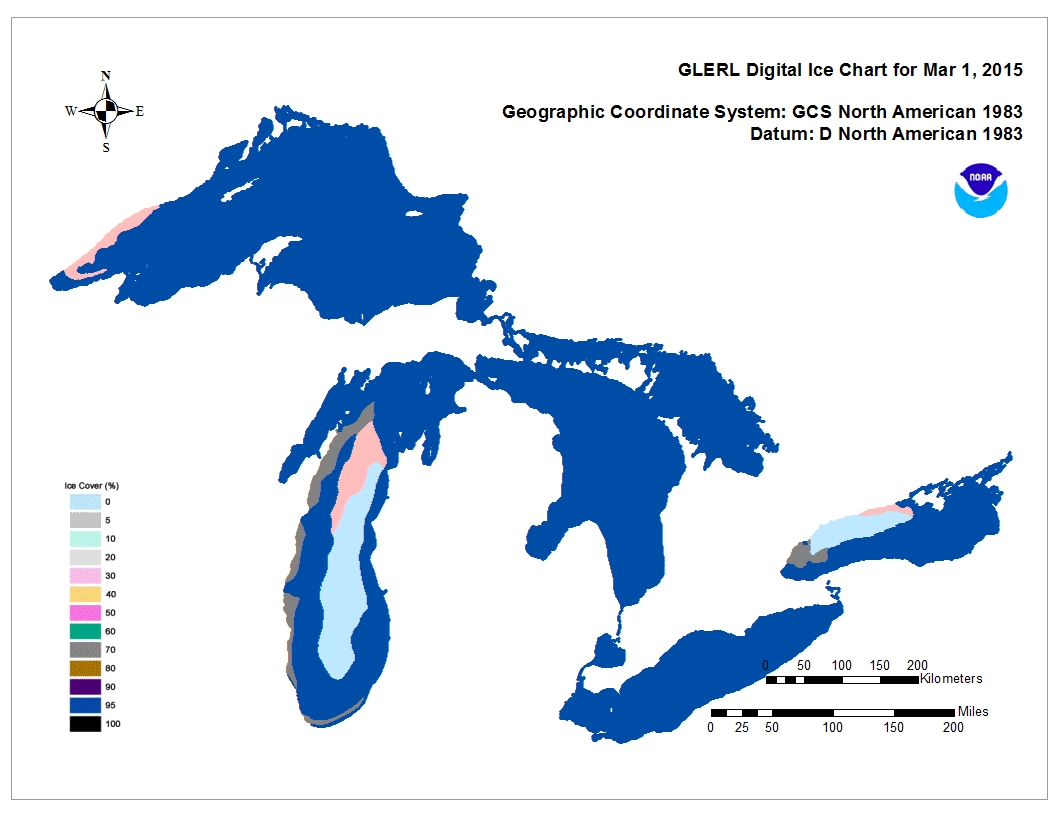 2015 summary |
2016 Max ice cover: 2/14/2016 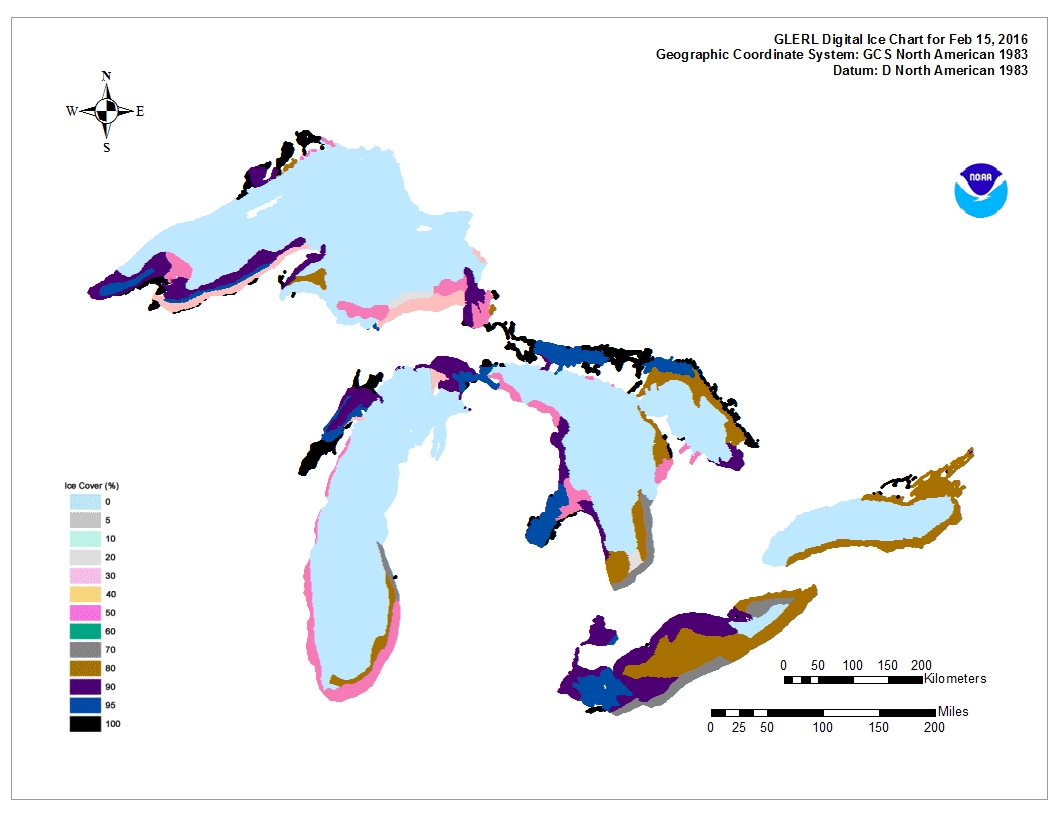 2016 summary |
2017 Max ice cover: 3/14/2017 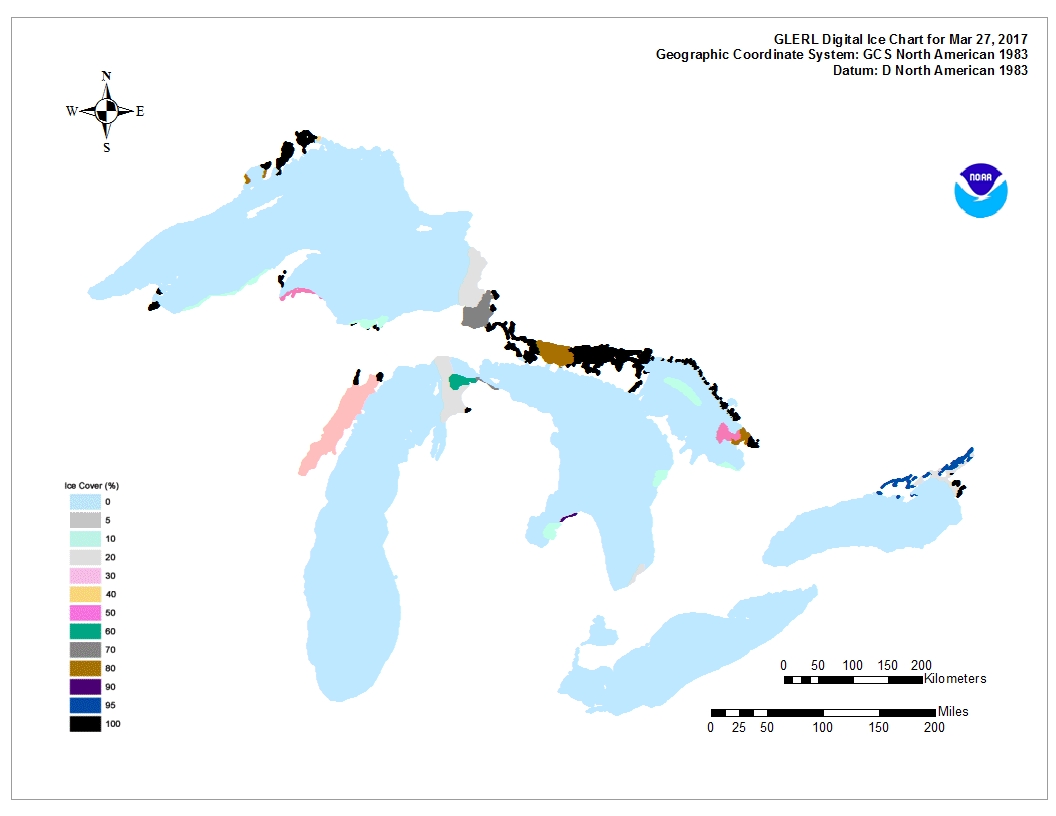 2017 summary |
| 2018 Max ice cover: 2/11/2018 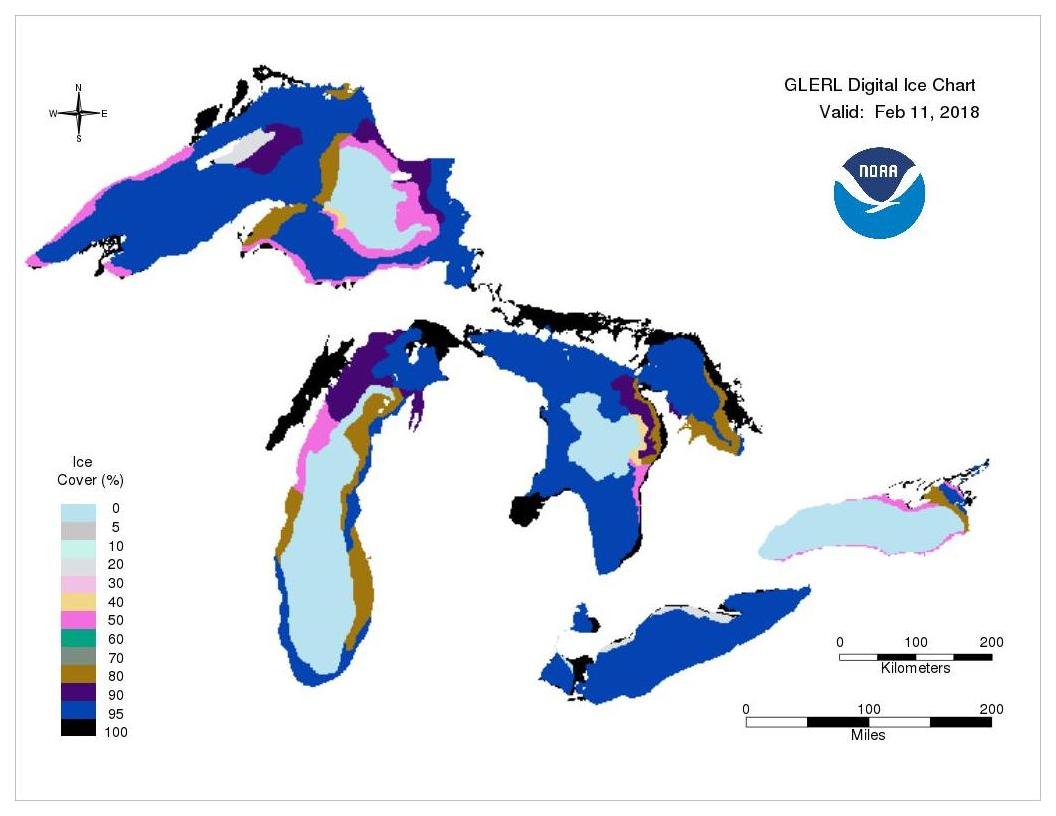 2018 summary |
2019 Max ice cover: 03/09/2019 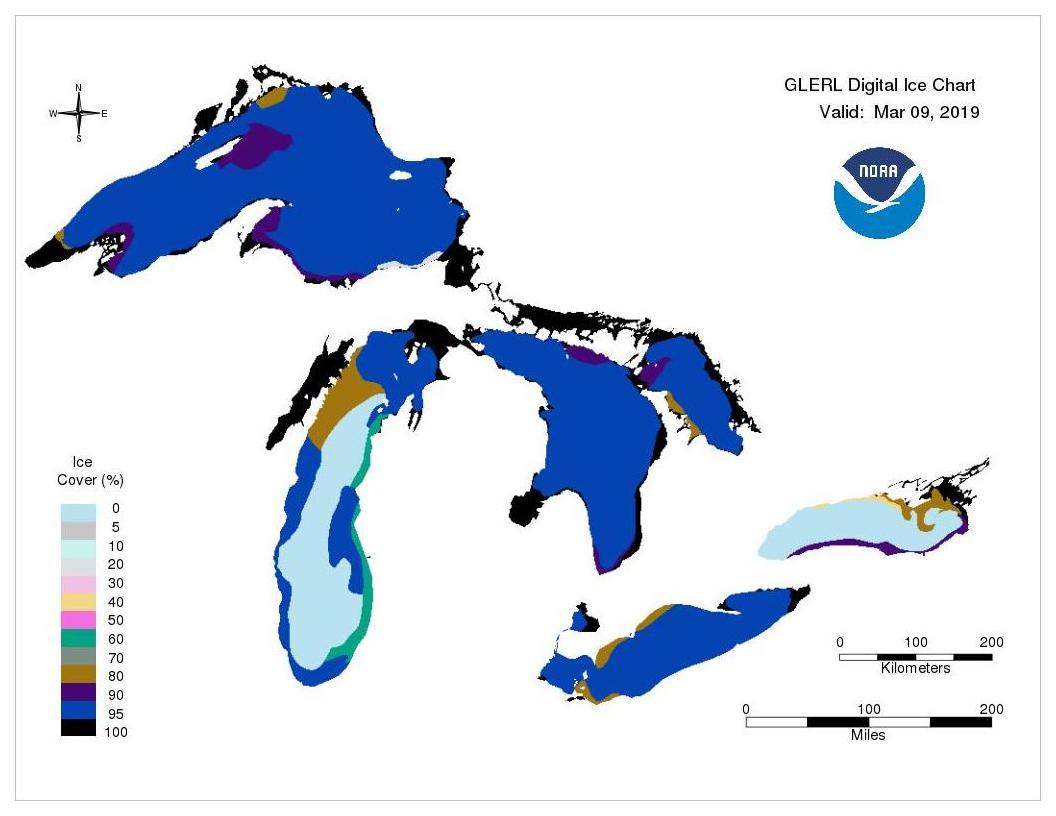 2019 summary |
2020 Max ice cover: 02/21/2020 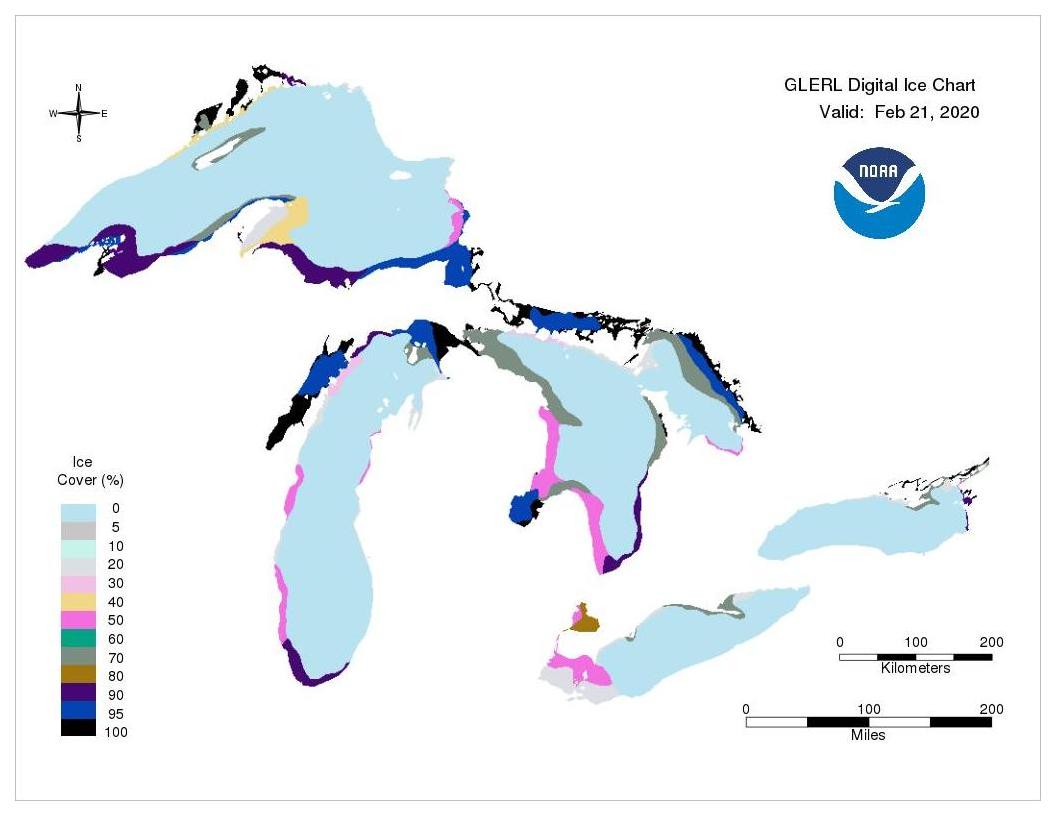 2020 summary |
2021 Max ice cover: 02/19/2021 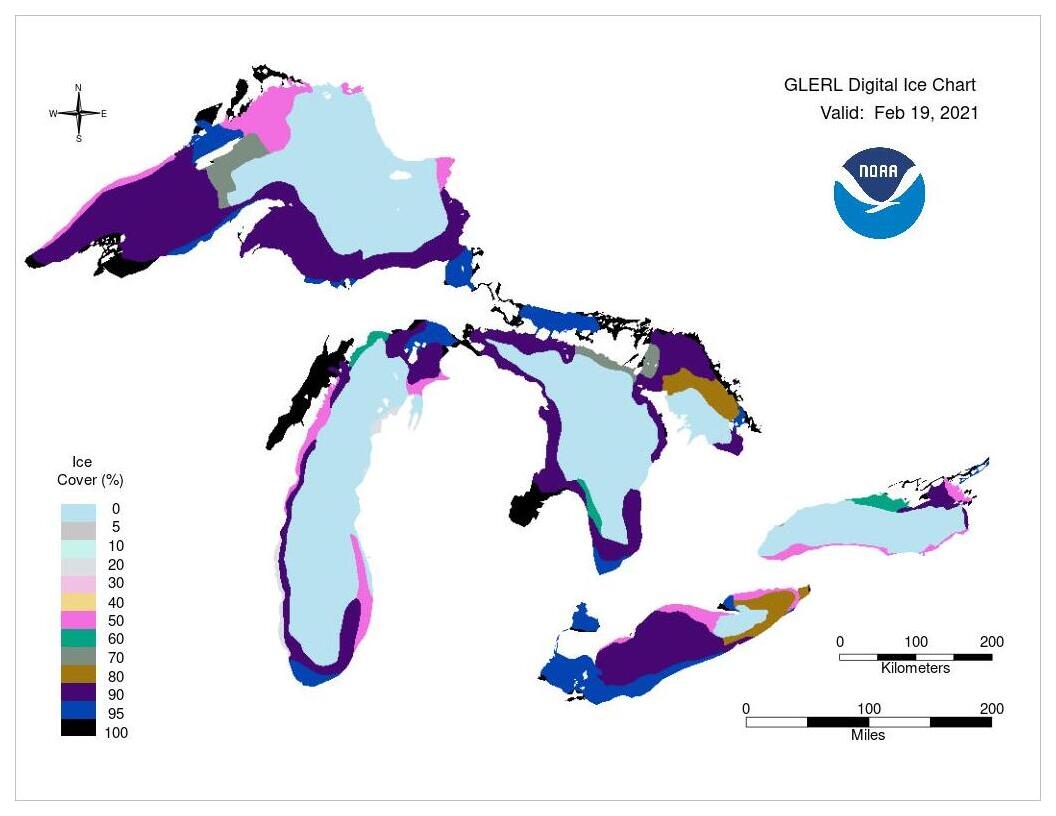 2021 summary |
2022 Max ice cover: 02/26/2022 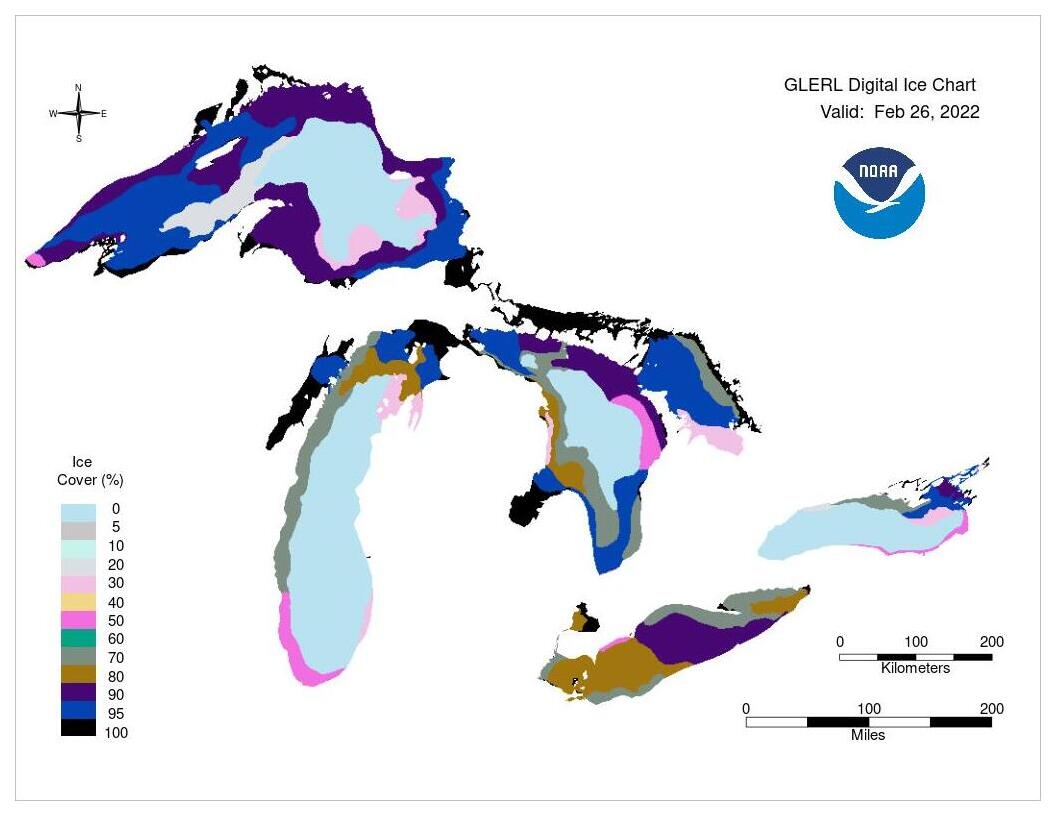 2022 summary |
|
2023 Max ice cover: 02/24/2022 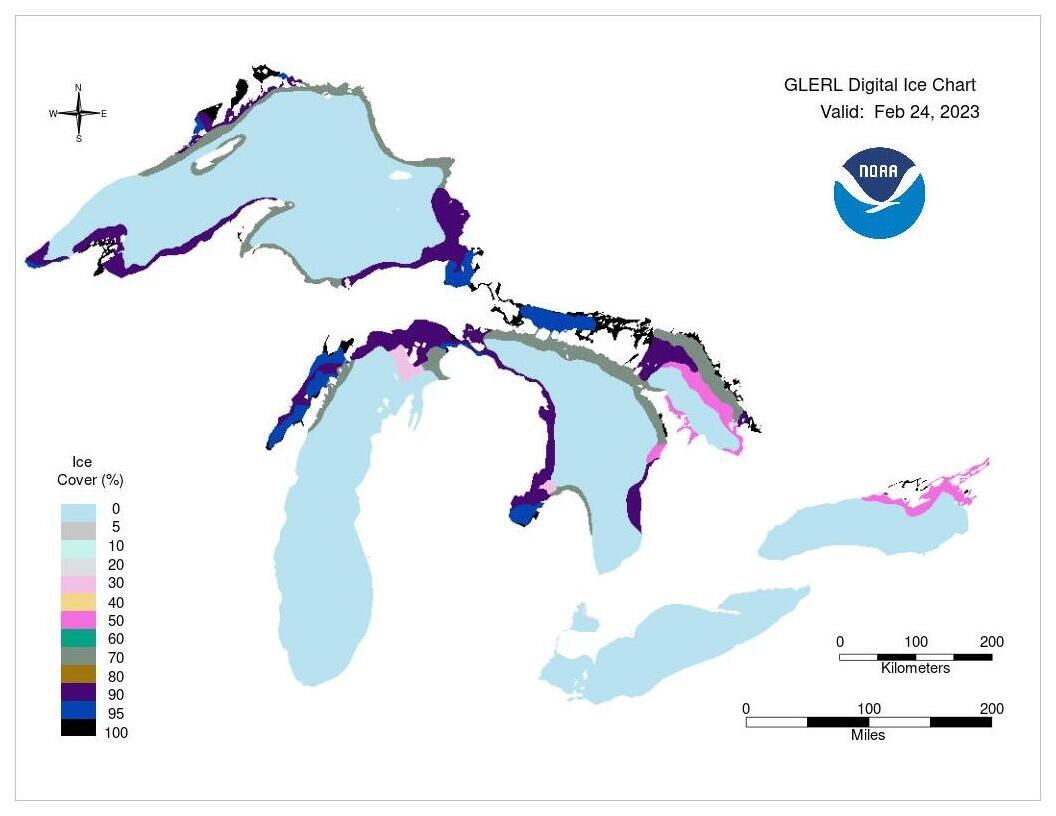 2023 summary |
||||
| Basinwide |
Lake Superior |
Lake Michigan |
Lake Huron |
Lake Erie |
Lake Ontario |
Data | Reference | |
| 1973-2002 |
A Great Lakes Ice Cover Digital Data Set for Winters 1973-2000 (Assel et al., 2002) |
| 2003-2005 |
Great Lakes Ice Cover Climatology Update: Winters 2003, 2004, and 2005 (Assel, 2005) |
| 2006-2017 |
Temporal and Spatial Variability of Great Lakes Ice Cover, 1973-2010 (Wang et al., 2012) Great Lakes ice climatology update: Winter 2006-2011. Description of the digital ice cover dataset (Wang et al., 2012) Analysis of Great Lakes ice cover climatology: Winters 2006-2011 (Assel et al., 2013) Great Lakes Ice Climatology Update of Winters 2012-2017: Seasonal Cycle, Interannual Variability, Decadal Variability, and Trend for the Period 1973-2017 (Wang et al., 2017) Analysis of Great Lakes Ice Cover Climatology: Winters 2012-2017 (Wang et al., 2017) |
| 2020-present | A consistent Great Lakes ice cover digital data set for winters 1973-2019 (Yang et al. 2020) |
GLERL conducts research on ice cover forecasting on two different time scales: short-term (1-3 days) and seasonal. GLERL's short-term ice forecasting is part of the Great Lakes Coastal Forecasting System, a model used by the National Ocean Service to predict wind, waves, currents, and more. These ice nowcast and forecast products (concentration, thickness, velocity, and vessel icing) are still experimental but being transitioned to operations. GLERL's seasonal ice cover forecast is based on statistical and physical analysis and is also experimental.
Great Lakes Coastal Forecasting System (GLCFS) is a short-term physical modeling framework for predicting waves, currents, water temperature, and ice. GLCFS uses observed and forecasted atmospheric conditions to predict ice conditions up to 3 days in the future. Ice forecast products under development include ice thickness, vessel icing, and ice velocity. The ice concentration output has been validated extensively against avaiable observations
(Anderson et al. 2019.)
The following links to the
pages which contain visual summaries of current Great Lakes ice conditions.
| Superior |
Michigan |
Huron |
Erie |
Ontario |
 |
 |
 |
 |
 |
Research at NOAA’s Great Lakes Environmental Research Laboratory (GLERL) has shown that the interannual variability of Great Lakes ice cover is heavily influenced by four large-scale climate patterns referred to as teleconnections: the North Atlantic Oscillation (NAO), the Atlantic Multidecadal Oscillation (AMO), the El Nino/Southern Oscillation (ENSO) and the Pacific Decadal Oscillation (PDO). These teleconnection patterns impact Great Lakes regional climate and ice cover by influencing the location of the westerly jet stream over North America (Wang et. al, 2018; Bai and Wang 2012). The position of the jet stream largely dictates the origin of the air masses (e.g. North Pacific or the arctic) that will reach the Great Lakes region as weather systems move across the continent. The temperature and moisture content of these air masses play a key role in determining ice cover.
Note: For official NOAA ice cover forecasts on seasonal to sub-seasonal scales, see the US National Ice Center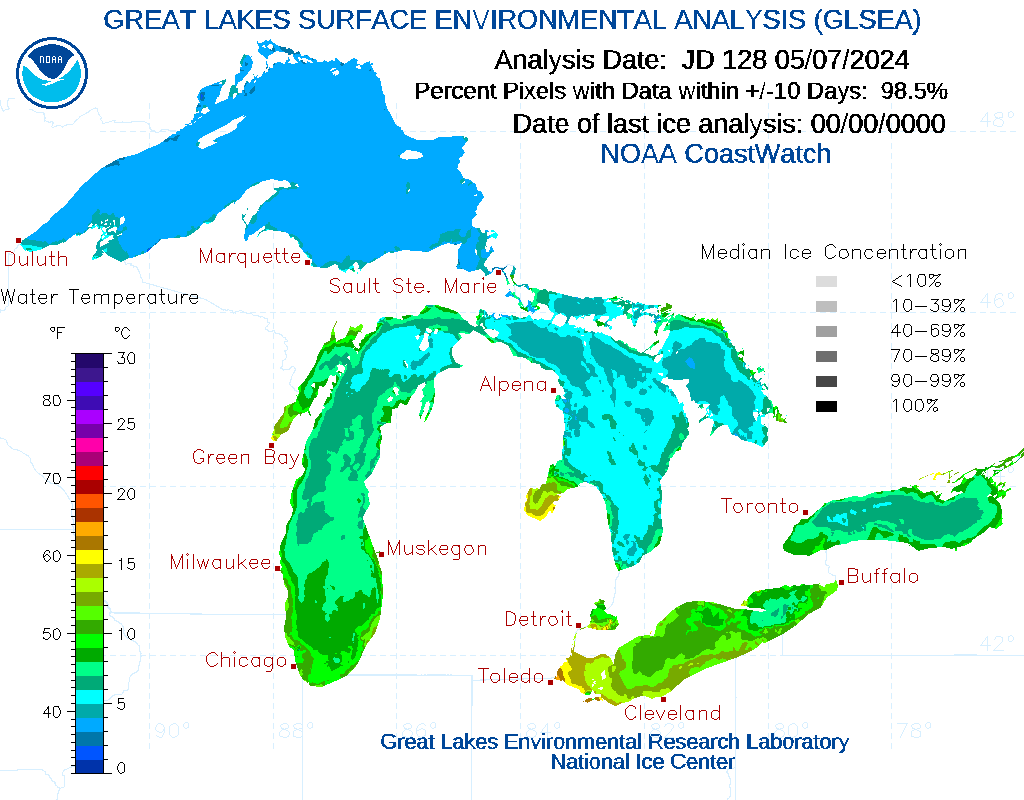
Graphic displaying the current Great Lakes surface water temperatures and extent of ice cover as observed by NOAA Coastwatch's Great Lakes Surface Environmental Analysis (GLSEA). GLSEA is a digital map of the Great Lakes surface water temperature and ice cover which is produced daily.
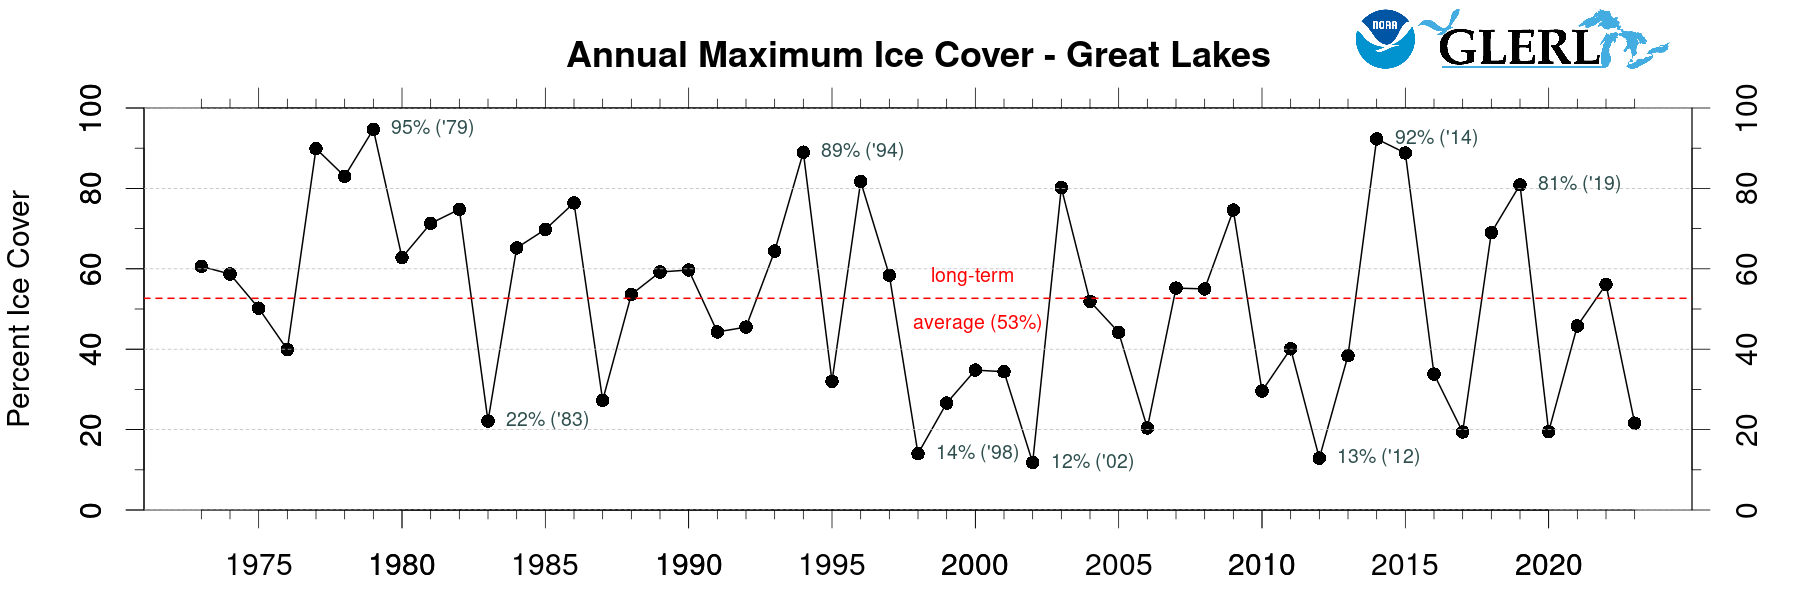
View the records* for Great Lakes Annual Ice Cover (percent) from 1973-2018 below:
Highest Annual Maximum Ice Cover (%) |
Year |
Lowest Annual Maximum Ice Cover (%) |
Year |
|
| Basin | 94.7 | 1979 | 11.9 | 2002 |
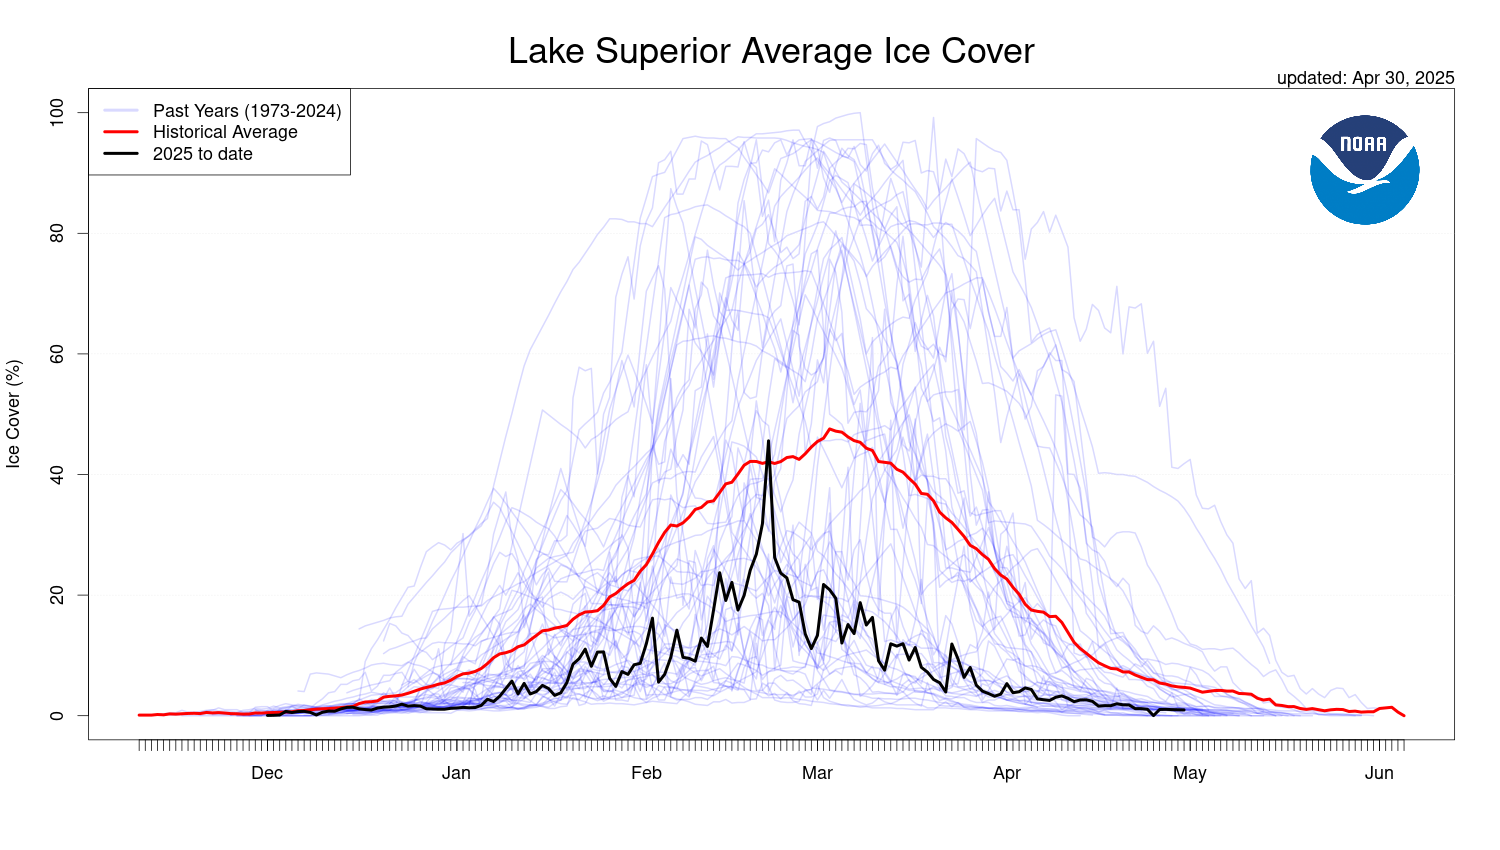
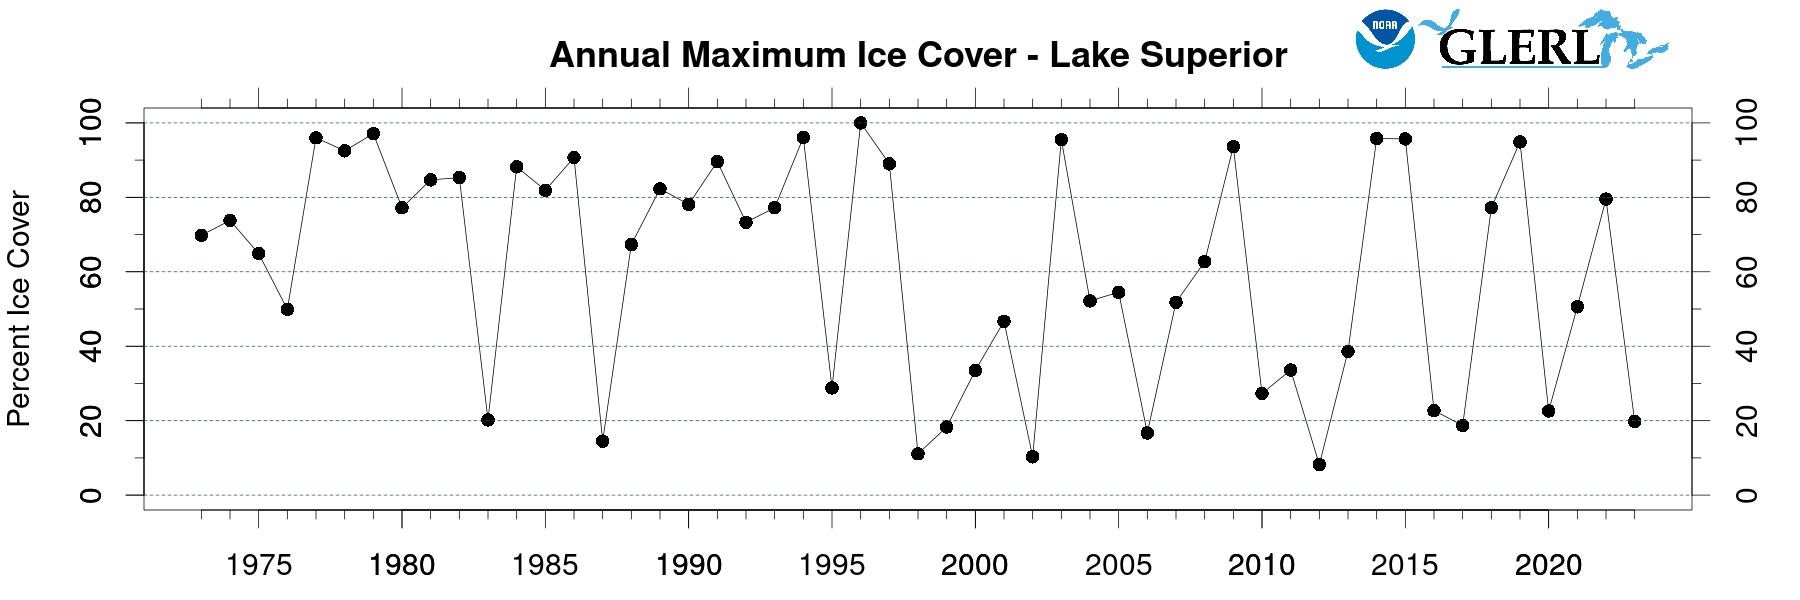
| Superior | 100 | 1996 | 8.5 | 2012 |
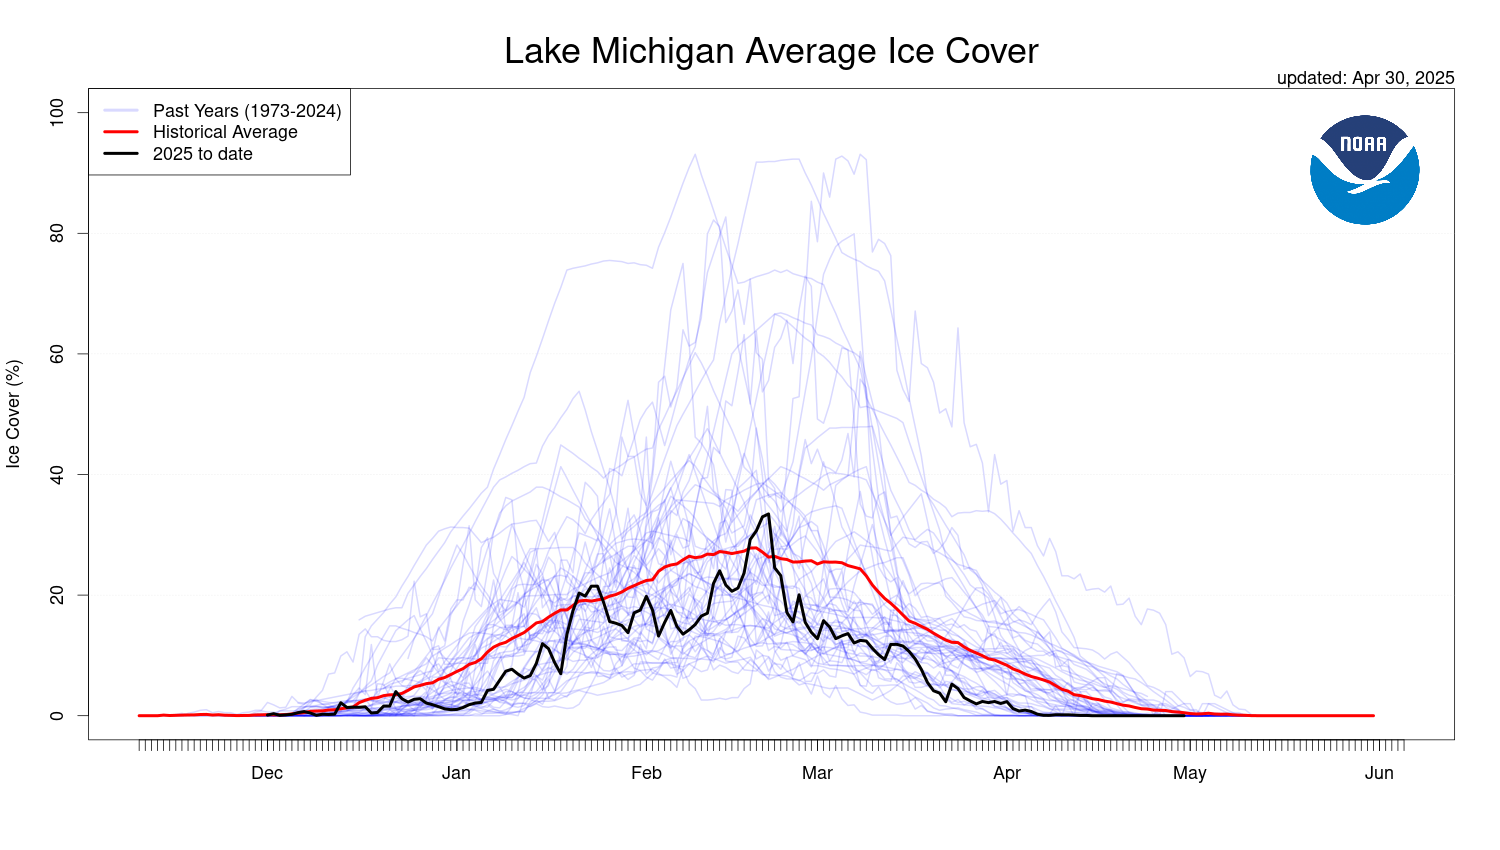
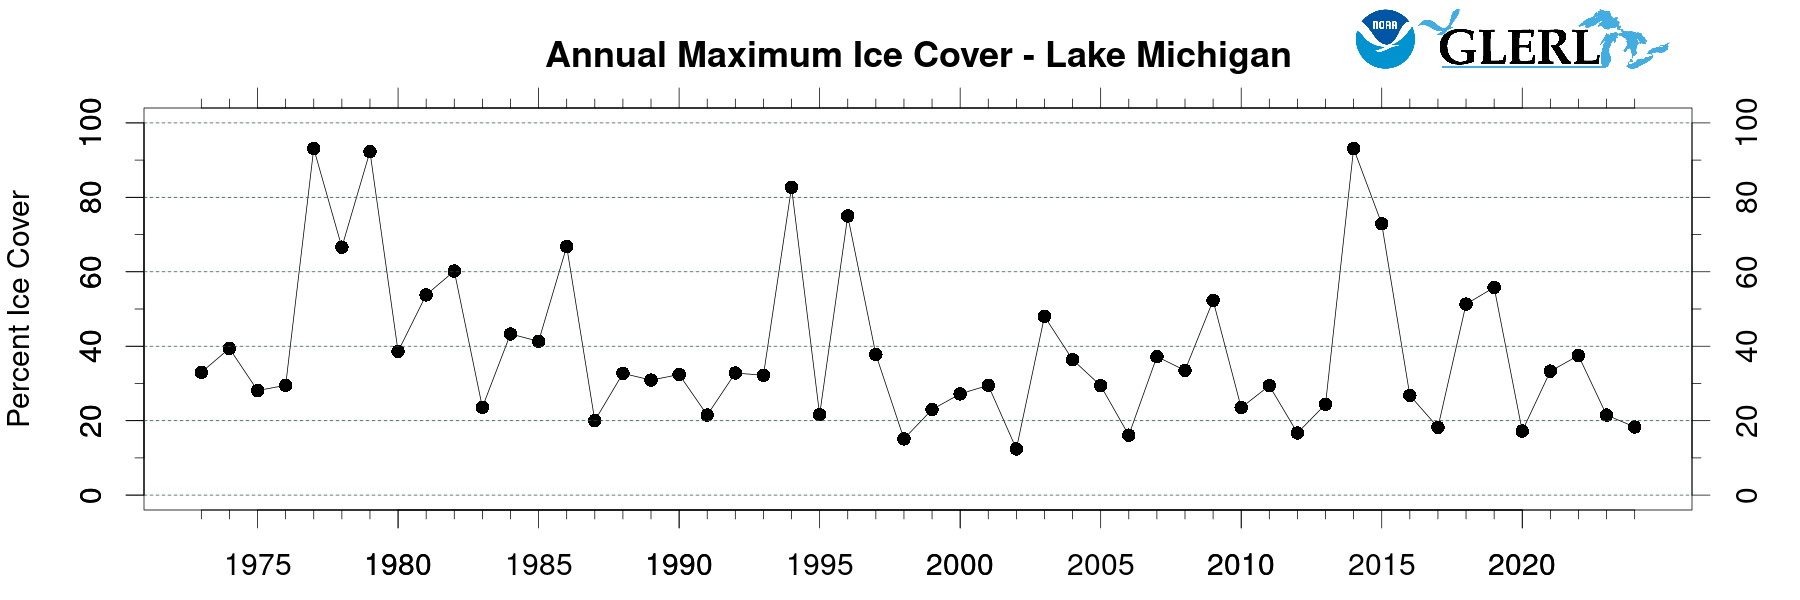
| Michigan | 93.1 | 2014 | 12.4 | 2002 |
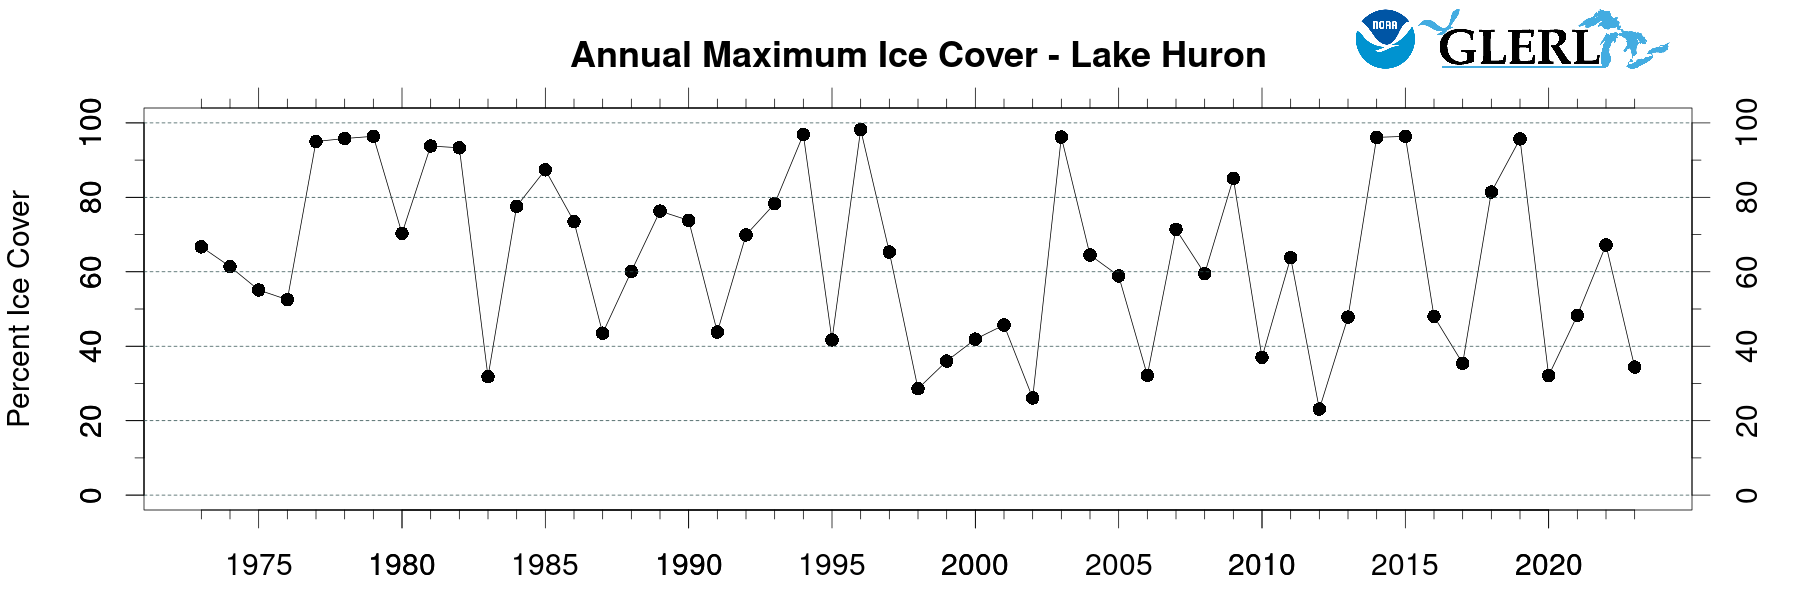
| Huron | 98.2 | 1994 | 22.8 | 2012 |
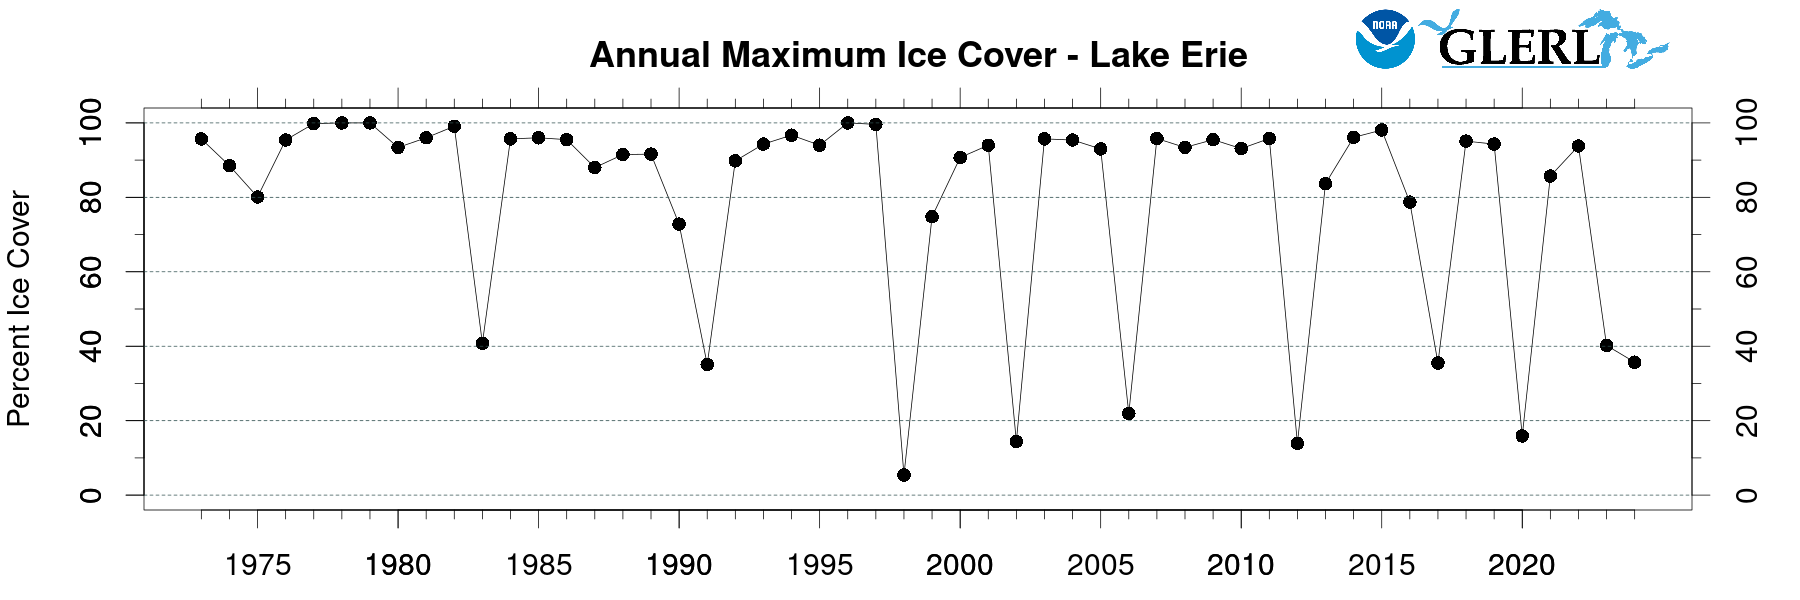
| Erie | 100 | 1978, 1979, 1996 | 5.4 | 1998 |
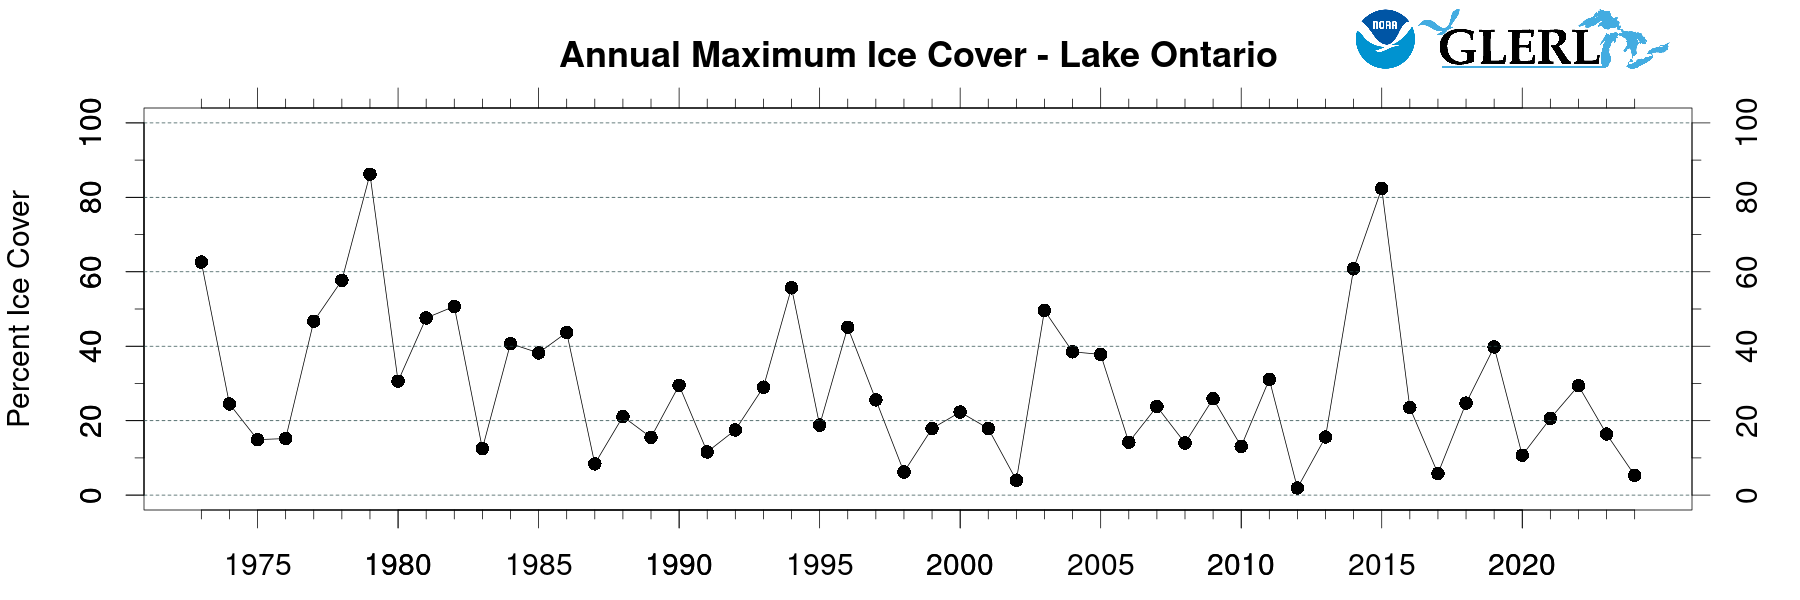
| Ontario | 86.2 | 1979 | 1.9 | 2012 |
*See Table 1 from: Wang, J., J. Kessler, F. Hang, H. Hu, A.H. Clites, and P. Chu. Analysis of Great Lakes ice cover climatology: Winters 2012-2017. NOAA Technical Memorandum GLERL-171. NOAA Great Lakes Environmental Research Laboratory, Ann Arbor, MI, 24 pp. (2017). http://www.glerl.noaa.gov/pubs/tech_reports/glerl-171/tm-171.pdf
from: Wang, J, J. Kessler, F. Hang, H. Hu, A.H. Clites, and P. Chu. Great Lakes Ice Climatology Update of Winters 2012-2017: Seasonal Cycle, Interannual Variability, Decadal Variability, and Trend for the Period 1973-2017 http://www.glerl.noaa.gov/pubs/tech_reports/glerl-170/tm-170.pdf
Lake Ontario's extreme depth (86 m average; 244 m maximum) translates to tremendous heat storage capacity. It also has a smaller surface area for heat loss. In addition, cold air outbreaks from the northwest and west are moderated by the waters of Lakes Superior, Michigan, and Huron. These factors combine to keep ice cover on Lake Ontario at a relatively low level most years.
Maximum ice cover on the lower lakes (like Lake Erie) normally occurs between mid-February and end of February. Maximum ice cover on the upper lakes (like Lake Superior) normally occurs between end of February and early March.
The relationship between ice cover, evaporation, and water levels is complex. Data on modeled evaporation shows that this process peaks in the fall, before ice cover formation. In a severe ice cover year such as 2014, the thermal structure of the lake could be impacted for the rest of the year, potentially reducing evaporation from the lakes next fall. Evaporation and precipitation are the major drivers of seasonal water level changes in the Great Lakes.
Ice extent plays a part in determining water temperature in the lakes later in the year, as incoming heat will have to melt the ice before it warms the water below. However, meteorological conditions and heat storage in the lakes are also critical components to the thermal cycle in the lakes.
Sometimes blue ice develops on the Great Lakes. This is an unusual phenomenon in the Great Lakes that is usually short-lived.
What causes blue ice?
| Additional Resources: | |
|---|---|
| Great Lakes Ice Images Great Lakes Ice Brochure US National Ice Center |
National Snow and Ice Data Center Environment and Climate Change Canada Daily Great Lakes Ice Charts |
| Contact: | |||
|---|---|---|---|
| Media Inquiries 202-713-6644 |
General Information 734-741-2235 |
Ice-Climate Modeling/Forecasting Jia Wang 734-741-2281 |
Ice Cover Data James Kessler 734-265-0887 |