
NOAA - Great Lakes Environmental Research Laboratory

| NOAA/GLERL is not an operational center. We make every effort to ensure accuracy and minimize downtime, however, we cannot guarantee that data and products will always be available and/or accurate. Our forecasts and products should be considered experimental. Please review our disclaimers. |
The Experimental Lake Erie Harmful Algal Bloom (HAB) Tracker model is no longer running. NOAA’s Great Lakes Environmental Research Laboratory collaborated with the NOAA National Ocean Service to transition the model output into the operational NOAA Lake Erie HAB Forecast product. NOAA issues forecasts for Lake Erie after sampling confirms presence of the HAB species Microcystis, during bloom season (typically July to October) when conditions are optimal for growth. The Lake Erie HAB Forecast is updated daily and provides information on current extent and trajectory of HABs as they form. A forecast analysis is updated twice-weekly times a week during the bloom season. For more information or to subscribe and receive the forecast analysis by email, please visit the NOAA Lake Erie HAB Forecast website.
Archived Experimental Lake Erie Harmful Algal Bloom (HAB) Tracker forecasts and full season animations for 2017-2019 can be found below.
An asterisk (*) indicates a date in which satellite data was unavailable due to cloud cover, therefore most the recent relatively cloud-free data was used to create the HAB extent analysis.
The upper left panel below shows the HAB Tracker lake surface forecast. The other panels provide additional information on lake conditions. See panel descriptions below. To view the latest images, refresh your browser and/or clear its cache.
HAB Tracker forecast
Experimental Lake Erie
Harmful Algal Bloom Tracker |
GLCFS nowcast & 5-day wind speed forecast |
Latest reported microcystins concentrations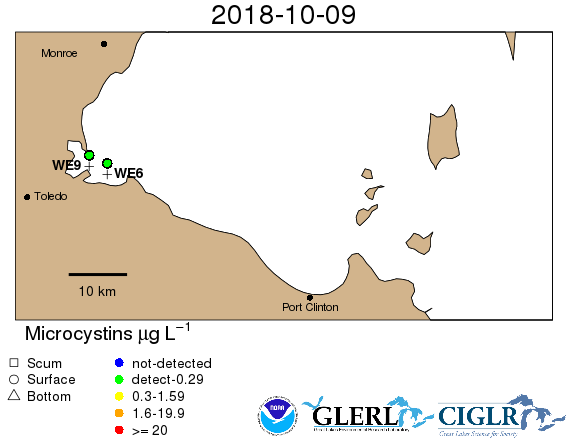
|
GLCFS nowcast & 5-day wave height forecast |
HAB Tracker forecast - This panel depicts the HAB Tracker 5-day forecast. The color scale indicates surface HAB concentration in terms of cyanobacterial chlorophyll-a.
GLCFS nowcast & 5-day wind speed forecast - The Great Lakes Coastal Forecasting System (GLCFS) nowcast uses observed winds from stations surrounding the lake, while the forecast uses the National Digital Forecast Database generated by the National Weather Service.
Latest reported microcystins concentrations - The HAB Tracker doesn't predict toxin concentrations, so the latest measurements are given here to provide context. Microcystins are the toxic compounds most commonly associated with Lake Erie HABs. The symbol shape indicates the depth at which weekly sampling occurred at each monitoring station. "Surface" is approximately 0.75 m deep in the water column. Symbol colors correspond with thresholds identified by the Ohio Environmental Protection Agency. Microcystins concentrations exceeding the Elevated Recreational Public Health Advisory are indicated in red. Note that the HAB Tracker uses a different color scale – the HAB Tracker does not indicate toxin concentrations.
GLCFS nowcast & 5-day wave height forecast - The wave height forecast is produced by the Great Lakes Coastal Forecasting System (GLCFS).
Please view the laboratory's Disclaimer and Intellectual Property Notice. If you would like to provide feedback on the HAB Tracker, access the user survey developed by the Cooperative Institute for Great Lakes Research (CIGLR). (This is not a NOAA survey.)
Dates above with an asterisk (*) indicate the forecast, or the previous forecast that was referenced in its production, was ran without new satellite imagery and a resulting HABs extent analysis.
Sensors attached to satellites gather data, which is processed into the cyanobacterial index, an indicator of the abundance, or biomass, of the cyanobacteria associated with HABs. Processed satellite imagery is provided by the NOAA HAB Operational Forecasting System. The cyanobacterial index scale is converted to a cyanobacterial chlorophyll scale for use in the HAB Tracker, a similar indicator of cyanobacterial abundance.
True-color satellite image of Lake Erie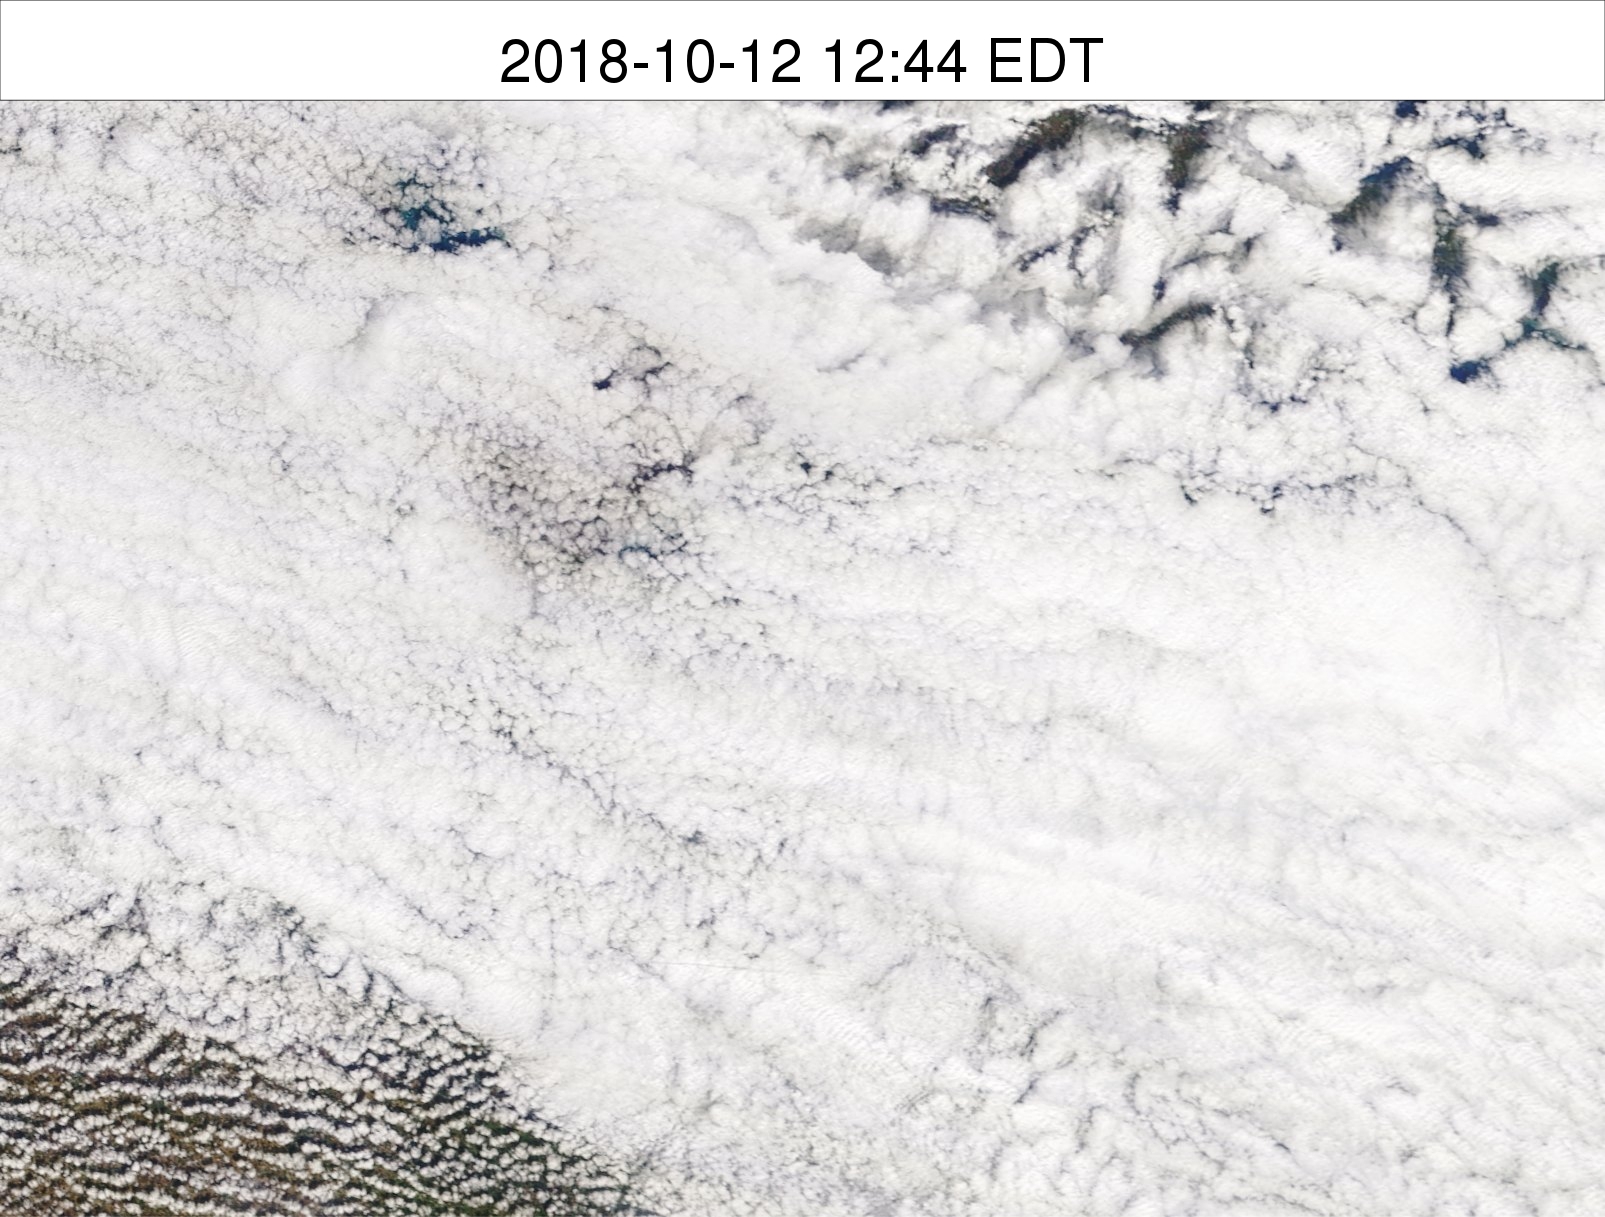 |
HABs extent analysis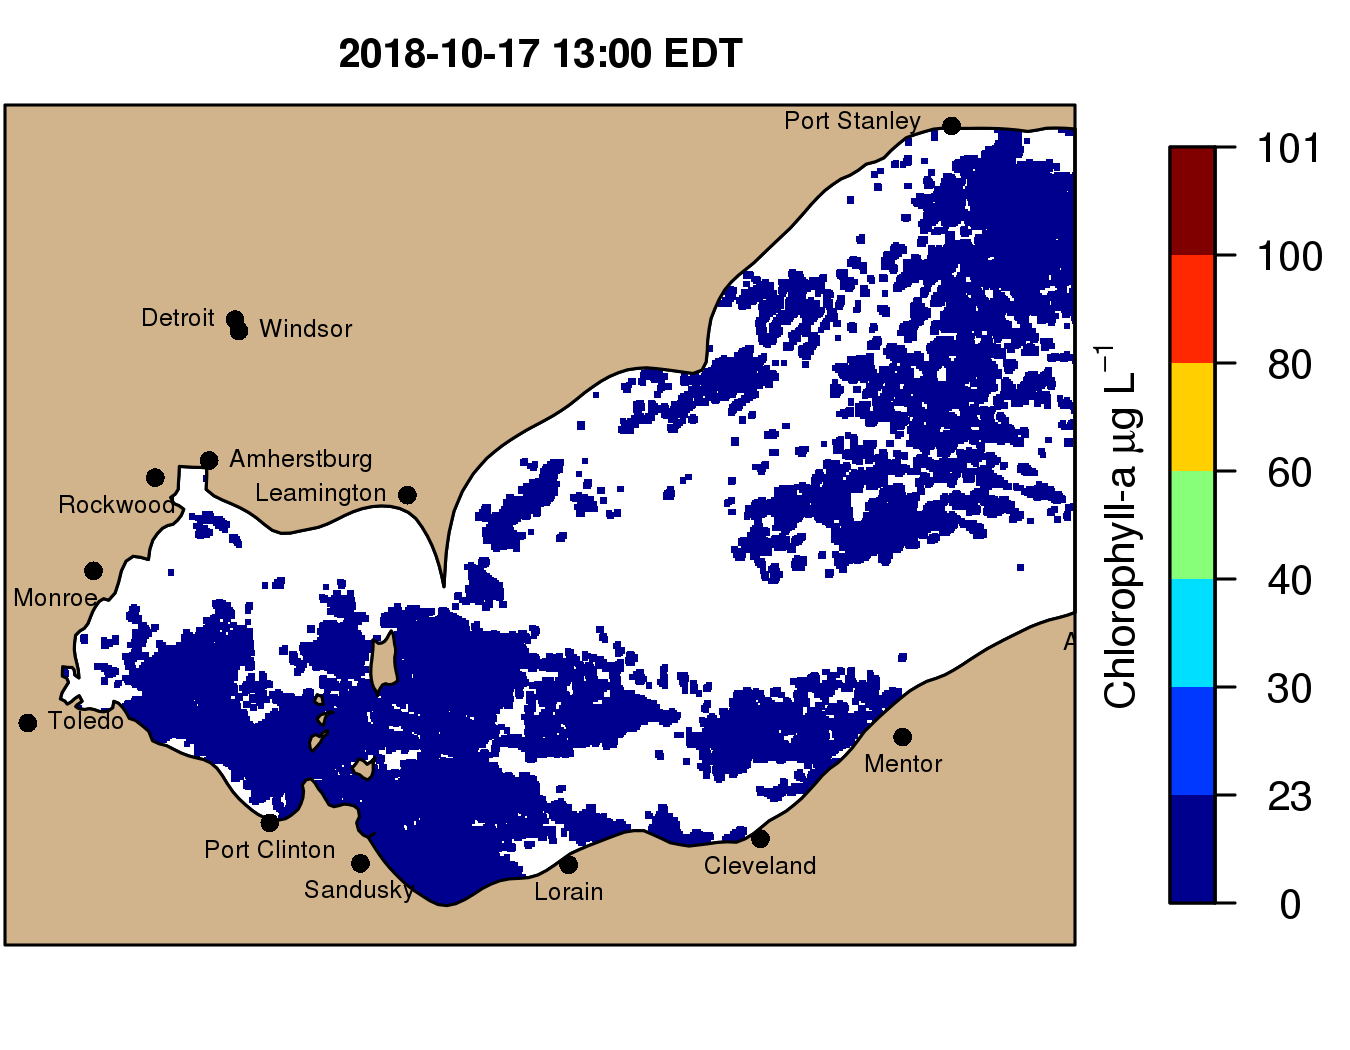 |
|
Latest relatively cloud-free MODIS satellite image of Lake Erie. For additional satellite imagery of Lake Erie, visit the NOAA Great Lakes CoastWatch webpage. |
Latest HAB extent analysis used to update the bloom location in the HAB Tracker model. HAB extent analysis is provided by NOAA HAB Operational Forecasting System, derived from NASA MODIS Aqua/Terra, or Copernicus Sentinal 3 satellite data. |
Lake Erie HABs usually consist of colonies of the cyanobacterium Microcystis, which float to the surface during calm periods and are mixed down into the water column during windy periods. Mixing of the water column is influenced by wind speed, heating or cooling of the surface water, and thermal stratification—layering of the water due to the difference in density between warm surface water and cooler bottom water. The model assumes that Microcystis colonies float, but it is recognized that some colonies sink. Therefore, it may be anticipated that sinking Microcystis colonies, and other sinking algae, will accumulate on the bottom under the same calm conditions that lead to formation of floating scums at the surface.
The panels below depict model-predicted vertical distribution of buoyant Microcystis colonies, and temperature. Click on a station location (+) in the upper right image to see forecast information for a particular station.
HAB Tracker forecast at selected station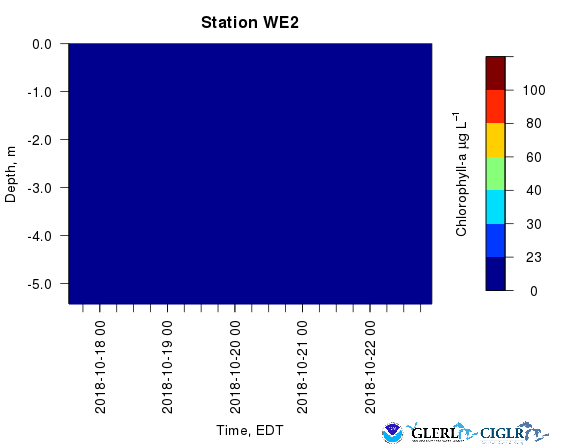
|
Click on + to select station and update plots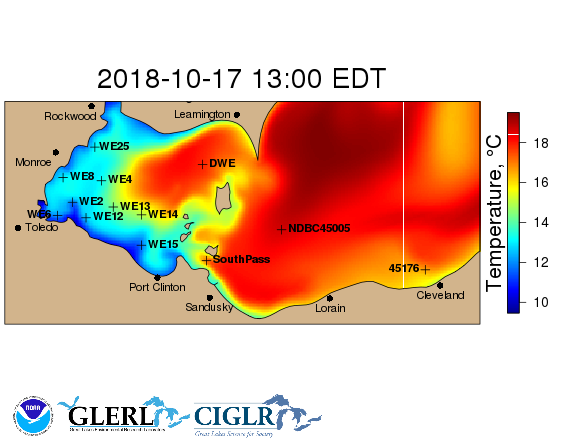
|
Vertical distribution of buoyant Microcystis colonies at the selected station. |
Station locations and modeled lake surface temperature. |
Modeled water temperature at selected station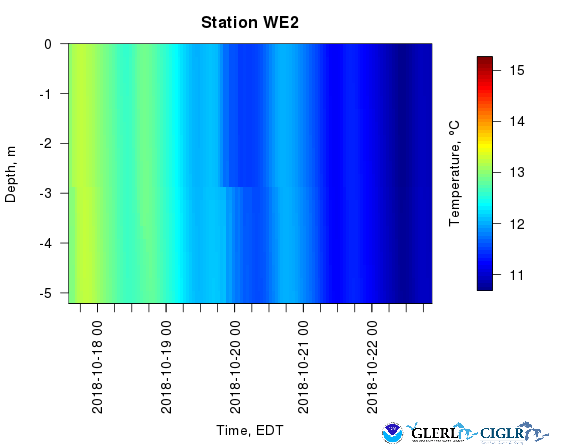 |
Vertical mixing conditions for buoyant Microcystis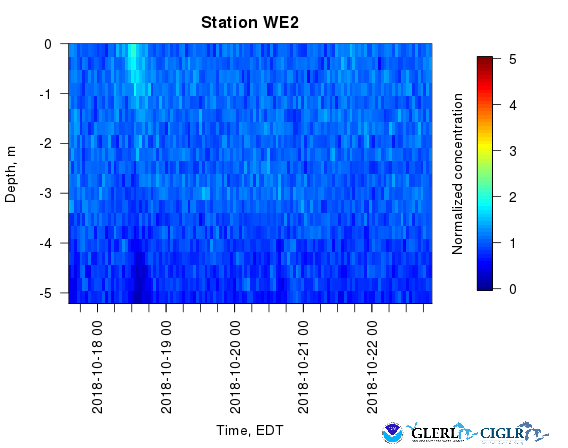 |
|
Time series of the vertical profile of water temperature at the station location from the Great Lakes Coastal Forecasting System model for the nowcast and forecast periods. |
This figure shows whether floating Microcystis colonies would be likely to form surface scums or to mix uniformly from surface to bottom under the modeled vertical mixing conditions at the station. This figure does not predict the presence of HABs at the station. |
These retrospective animations show the predicted surface chlorophyll concentrations estimated by the Experimental Lake Erie HAB Tracker model for the entire bloom season.
|
HAB Tracker: Mark Rowe Research Physical Scientist NOAA GLERL (734) 741-2172 |
Lake Erie HAB Forecast: Karen Kavanaugh HAB Product Coordinator NOAA CO-OPS (240) 533-0601 |

