
NOAA - Great Lakes Environmental Research Laboratory

The Experimental Lake Erie Hypoxia forecast is updated daily, and uses a hydrodynamic model and weather forecast data to predict the location and movement of hypoxic bottom water up to five days in advance. Hypoxia is a condition of low dissolved oxygen (< 2 mg/L) that can be harmful to aquatic life. Hypoxic upwelling events along the coast can impact operations at drinking water plants.
The Experimental Lake Erie Hypoxia Forecast is transitioning to operations at NOAA’s National Centers for Coastal Ocean Science (NCCOS). In support of the transition, GLERL will continue to update this webpage through the 2024 hypoxia season, but NOAA is directing forecast users to the new operational web page. Email updates regarding the hypoxia forecast and predicted hypoxic upwelling events will come from NCCOS. For additional information, or to be added to the email list, contact hab@noaa.gov.
Forecast bottom temperature and dissolved
|
Forecast change in bottom temperature and dissolved oxygen: |
Wind Rose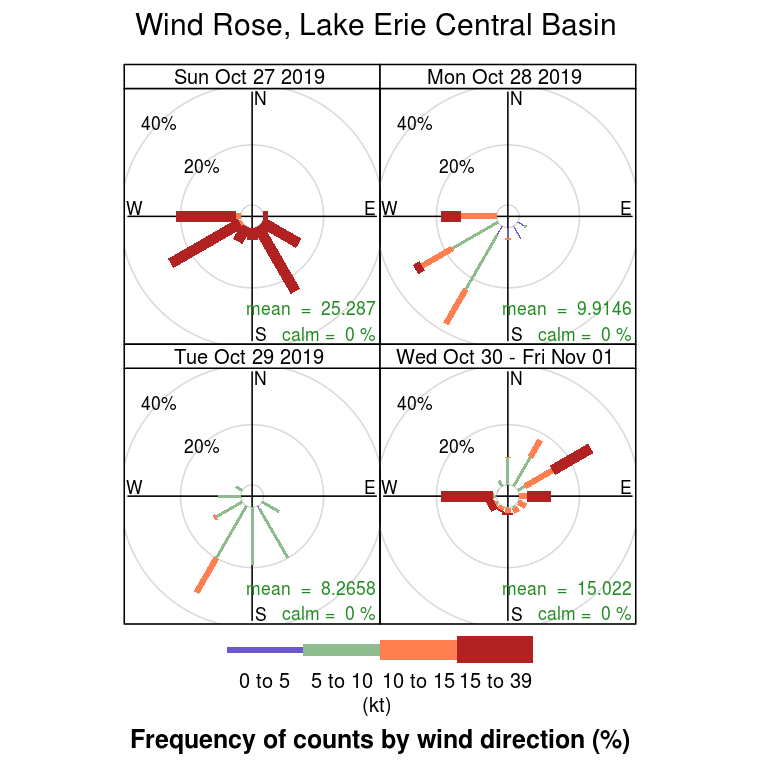
|
Cleveland to Port Stanley (Canada) Cross-section |
The Experimental Lake Erie Hypoxia forecast is a forecast model in development for transition to NOAA operations. Other panels provide additional information on lake conditions. For the latest images, refresh your browser and/or clear its cache.
Forecast bottom temperature and dissolved oxygen - This panel depicts modeled lake bottom temperatures in degrees Celcius and bottom dissolved oxygen, and also a cross-sectional view of Lake Erie forecast model data from Cleveland to Port Stanley (Canada). Red color is associated with higher values, and blue color with lower values, according to the color scale that appears beside the plot. Observations are plotted as white-edged circles, filled with a color according to the color scale. These observations are provided by the Great Lakes Observing System , Ontario Ministry of the Environment, Conservation and Parks, the Regional Science Consortium , the Real-Time Aquatic Ecosystem Observation Network (RAEON) at the University of Windsor , and collaborations with regional operators of water treatment plants including the Cleveland Water Department, Lake County Department of Utilities , as well as the Cleveland Water Alliance, LimnoTech, and Freeboard Technology (These links are external to NOAA-GLERL).
Forecast change in bottom temperature and dissolved oxygen - This panel depicts the Experimental Lake Erie Hypoxia 4-day Forecast. The color scale indicates changes in dissolved oxygen (D.O.) concentrations over a period of 4 days, beginning at noon yesterday (EDT). Areas in green indicate no change in dissolved oxygen levels, while areas in blue indicate a decrease and areas in red indicate an increase.
Wind Rose - This panel depicts the frequency of occurrence of wind directions and speeds for yesterday, today, tomorrow, and the following 3 days. The length of each spoke indicates how frequently a wind blows from a particular direction. Wind speeds are indicated by color, as given by the color scale at the bottom of the plot. The data were sampled from the wind data used to drive the hydrodynamic model simulation at locations around the central basin of Lake Erie, for additional detail see the Great Lakes Coastal Forecasting System (GLCFS)
| NOAA/GLERL is not an operational center. We make every effort to ensure accuracy and minimize downtime, however, we cannot guarantee that data and products will always be available and/or accurate. Our forecasts and products should be considered experimental. Please review our disclaimers. |
|
General Inquiries: oar.glerl.www@noaa.gov (734)741-2235 |
Data Inquiries: oar.glerl.data@noaa.gov |

