NOAA - Great Lakes Environmental Research Laboratory
View data
View data in comma delimited format from the above plot here. Copy, paste into a text editor, and save as 'insert_file_name.csv'. You should then be able to open it in your favorite spreadsheet program.
NOAA/GLERL is not an operational center. We make every effort to ensure accuracy and minimize downtime, however, we cannot guarantee that data and products will always be available and/or accurate. Our forecasts and products should be considered experimental. Please review our disclaimers.
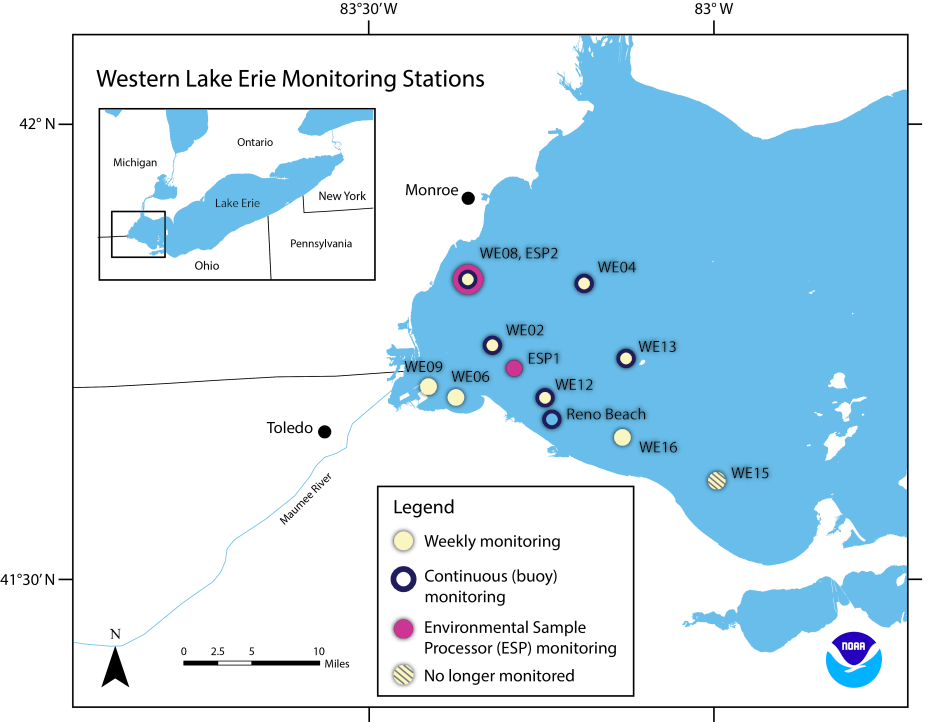
Most recent real-time data from western Lake Erie (Click here to collapse)
Variable
WE2
WE4
WE8
WE13
Time
"2024-10-18 16:01:00"
"2024-10-21 21:31:00"
"2023-10-11 19:16:00"
"2019-10-02 16:46:00"
Air Temperature (deg C)
13.99
0
15.1
23.43
Water Temperature (deg C)
14.12
NA
12.97
NA
Barometric Pressure (mbar)
1012.521
0
988.3999
984.3978
Wind Speed (m/s)
1.292
0
0.55
0.531
Wind Direction (deg clockwise from North)
192.1
0
135.7
10.4
Turbidity (NTU)
7.344
NA
54.43
NA
Specific Conductivity (μS/cm)
259.2
NA
0.492
NA
Chlorophyll A (RFU)
0.596
NA
0.142
NA
Blue-Green Algae (RFU)
0.018
NA
1.283
NA
Flourescent Dissolved Organic Matter (RFU)
2.684
NA
-1.391
NA
Nitrogen (mg/L)
0.3494
NA
0
Dissolved Oxygen (mg/L)
9.97
NA
10.67
NA
pH
8.43
NA
7.042
NA
Phosphorus Timestamp
2024-10-18 15:05:13
NA
2023-10-11 18:05:12
NA
Phosphorus (μgP/L)
8.1
NA
-2.7
NA
OR - Select variables to compare between all sites:
Viewing mode will be indicated with light green background color.
This page automatically displays data which are available. If no data appear
for a selected site or variable, no data are available for that site, variable and selected time.
2016-2020 times are GMT.
2015 and earlier times are local (ET) with the exception of WE4 which is in GMT.
Select a date below along with how many days before and after that date
you would like to view. 30 days maximum (± 15).
Zoom: click-drag, Pan: shift-click-drag, Restore: double-click